I. INTRODUCTION
Optical remote sensing image object detection is increasingly finding applications across various domains. It is widely utilized in civilian sectors, such as search and rescue operations, disaster monitoring and prediction, as well as urban construction planning. In the military domain, the detection and positioning of remote sensing objects enable the rapid conversion of remote sensing data into actionable intelligence. This capability proves invaluable in analyzing battlefield situations, accurately identifying the positions of potential targets, and subsequently formulating precise and timely military strategies [1]. As a result, achieving real-time and accurate detection holds significant importance, profoundly impacting both societal and economic development, as well as national defense efforts.
In recent years, deep learning techniques have gained significant traction among researchers tackling video generation and analysis tasks. These techniques involve using a preceding set of video frames to predict the subsequent set of frames within a given video sequence [2]. Some scholars have also leveraged image resolution enhancement in videos to facilitate local motion detection, allowing for the prompt identification of unwanted motion within the video content [3]. Inspired by advancements in video image detection algorithms, we aim to employ deep learning algorithms for object inspection and recognition in remote sensing images. This endeavor bears similarities to the individual frame detection commonly utilized in video analysis. Currently, mainstream remote sensing object detection algorithms predominantly fall into two categories [4-12]. In recent years, numerous scholars have dedicated their research efforts to this field. For instance, Xue Yali and Yao Qunli have proposed a lightweight object detection method tailored to enhancing the accuracy of identifying small objects amidst complex backgrounds in optical remote sensing images. This innovative approach tackles the challenges associated with detecting small objects, particularly when they are closely arranged. By incorporating a weighted fusion feature network, each layer’s feature map receives a dynamically learned weight coefficient during network training, thus enhancing the fusion of deep and shallow layer features. Moreover, the introduction of the CIoU loss function expedites network convergence, meeting real-time requirements [13]. Yao Qunli, in another study, has put forth a one-stage multi-scale feature fusion method designed for aircraft object detection, addressing the issue of low detection accuracy concerning small-scale aircraft objects in complex scenes. Regarding dataset utilization and processing, Vishal Pandey and colleagues have proposed several methods to enhance object detection in aerial images, promising substantial improvements in current aerial image detection performance [14].
While one-stage detection algorithms like YOLOv3, YOLOv4, and SSD offer faster detection speeds compared to two-stage detection algorithms, their network models tend to be relatively large and may not meet the practical lightweight deployment requirements. Previous research efforts have partly addressed the challenge of relatively low detection accuracy in one-stage algorithms by enhancing the network structure and employing various techniques. However, these enhancements often increased the network’s complexity without achieving a satisfactory balance between detection accuracy and speed.
In light of these challenges, this paper introduces a lightweight multi-scale enhancement algorithm for remote sensing image detection. This approach effectively extracts and fuses features from remote sensing objects at different scales, addressing issues of errors and omissions in the detection process resulting from scale variations. Careful consideration is given to the trade-off between speed and accuracy in detection, resulting in a well-balanced approach.
To improve feature fusion at different scales, an adaptive spatial feature fusion mechanism is employed, leading to enhanced detection performance for remote sensing objects of varying sizes [15]. Additionally, the original algorithm’s CIoU frame position loss function is replaced with the SIoU loss function [16]. The original CIoU loss function did not account for the mismatched direction between the required real frame and the predicted frame, which could lead to slow convergence and reduced detection efficiency. The SIoU loss function incorporates the vector angle between the real frame and the predicted frame, along with a redefined penalty index, thereby improving network training convergence speed and remote sensing image detection effectiveness.
Finally, the publicly available RSOD dataset [17] and NWPU VHR-10 [18] dataset was utilized as experimental data to evaluate the network’s performance and compare it with other widely used object detection algorithms.
II. RELATED WORK
Feature fusion in object detection refers to the integration of features from various layers or modules within a network to enhance model performance and accuracy. The goal of feature fusion is to comprehensively leverage feature information at different levels to capture multi-scale object details, enrich contextual semantics, complement features across various levels or modules, and facilitate cross-layer feature propagation. There are several feature fusion methods in object detection, each with different variants and improvements across various research studies.
Among the commonly utilized feature fusion methods in object detection:Feature Pyramid Network (FPN) [19]: FPN is a widely adopted multi-scale feature fusion approach. It constructs a feature pyramid structure to facilitate cross-layer feature fusion. This method effectively captures semantic information from objects at multiple scales and provides rich contextual information. Pyramid Convolutional Neural Network (PANet) [20]: PANet is an enhanced version of the feature pyramid network that introduces both top-down and bottom-up feature propagation pathways. This modification better exploits contextual information between feature maps of varying scales. Deformable Convolutional Network (DCN) [21]: DCN is a feature fusion method designed to capture local object detail by learning adaptive deformable convolution kernels. It introduces spatial transformations in the feature extraction stage to adapt to object deformations and scale variations. Channel Attention Module (CAM) [22]: CAM is a feature fusion method that incorporates an attention mechanism. It adaptively adjusts the weight of each channel in the feature map to enhance the expression of essential features. Hybrid Feature Fusion Methods (e.g., BiFPN [23] and NAS-FPN [24]): These methods leverage diverse feature fusion strategies, including combining multi-scale feature pyramids with attention mechanisms. Such approaches significantly enhance the performance of object detection models. This article provides an overview of various feature fusion techniques in object detection, offering insights into their roles in improving model capabilities.
Adaptive Spatial Feature Fusion (ASFF) [25]: ASFF’s primary concept revolves around dynamically adjusting feature weights based on the object’s representation requirements across different spatial scales. This approach learns weight coefficients to adaptively combine multi-scale features, significantly improving the model’s capacity to handle object detection at various scales. One notable advantage of this technique lies in its capability to dynamically fine-tune feature fusion weights, considering changes in object scale and contextual information. This adaptability enhances the detection of objects with varying scales. Following experimentation, we have opted for this adaptive feature fusion mechanism to bolster the performance and resilience of our object detection model, particularly when addressing tasks involving multi-scale objects. It is particularly well-suited for fulfilling the feature fusion demands of remote sensing image object detection discussed in this paper.
In the preceding section, we discussed feature fusion methods in object detection. Now, our focus shifts to the modification of the loss function within the network model. The YOLO series of algorithms introduced a transformative approach to object detection by framing it as a regression problem. This involves simultaneously predicting both the bounding box and category information of objects in a single forward pass. The YOLO series comprises multiple versions, each incorporating distinct loss functions and refinements. YOLOv1 primarily relies on two loss functions: bounding box regression loss and classification loss [26]. YOLOv2 builds upon YOLOv1 by introducing additional loss functions, including confidence loss, bounding box coordinate loss, category loss, and object loss [27]. Furthermore, YOLOv2 introduces multi-scale training and prediction, leveraging a more intricate grid division to enhance detection performance for smaller objects. YOLOv3 further refines the loss functions from YOLOv2 and introduces loss functions tailored to feature maps of varying scales.
Loss functions in object detection models encompass various components, including confidence loss, bounding box coordinate loss, category loss, object loss, and segmentation loss for occlusion detection [28]. YOLOv4 [29] and YOLOv5 [30] build upon this foundation by incorporating components such as confidence loss, bounding box coordinate loss, category loss, Landmark loss, and Focal Loss, among others. The specific implementations of YOLOv4 and YOLOv5 may exhibit subtle differences in their loss functions, depending on specific implementation details and the libraries utilized.
Furthermore, YOLOv5 introduces notable enhancements in the design of its loss function. It includes metrics like IoU (Intersection over Union), which primarily considers the overlapping area between the detection frame and the object frame. Building upon IoU, GIoU (Generalized-IoU) addresses bounding box alignment issues [31]. DIoU (Distance-IoU), an extension of IoU and GIoU, incorporates distance information from the bounding box’s center point to enhance detection accuracy. Additionally, CIoU (Complete-IoU), based on DIOU, considers the aspect ratio of the bounding box’s scale information, among other factors.
However, these loss functions primarily aggregate bounding box regression metrics, taking into account factors such as the distance between the predicted box and the ground truth box, overlapping area, and aspect ratio. Notably, the regression loss in the aforementioned models does not address the problem of direction mismatch, potentially leading to slower model convergence. During training, predicted boxes may oscillate around ground truth boxes, resulting in suboptimal results.
To address this issue, the SIoU (Smoothed IoU) loss function takes into account the vector angle between required regressions and redefines penalty indicators. These indicators encompass four components: angle cost, distance cost, shape cost, and IoU cost. This comprehensive approach significantly improves both training speed and inference accuracy.
III. REMOTE SENSING IMAGE DETECTION MODEL
In order to tackle the challenges associated with ship object classification and detection in high-resolution optical remote sensing images, this paper presents a novel network model for object detection, denoted as ASFF-SIoU-YOLOv5n (Adaptively Spatial Feature Fusion with SIoU-enhanced YOLOv5n) [32]. The overall structure of the proposed network model is illustrated in Fig. 1. To begin with, the foundational network, YOLOv5n, is employed as the basis for this model. YOLOv5n represents the version of YOLOv5 (version 6.0) with the smallest feature map width and network depth. Building upon this foundation, ASFF is seamlessly integrated into the YOLOv5n network architecture. This incorporation enhances the network’s capacity to effectively fuse features at varying scales. Furthermore, a significant upgrade is made to the original YOLOv5n loss function, replacing it with the more advanced SIoU loss function (Smoothed IoU). This enhancement plays a pivotal role in achieving a delicate balance between lightweight deployment, high-speed processing, and high-precision remote sensing object detection.
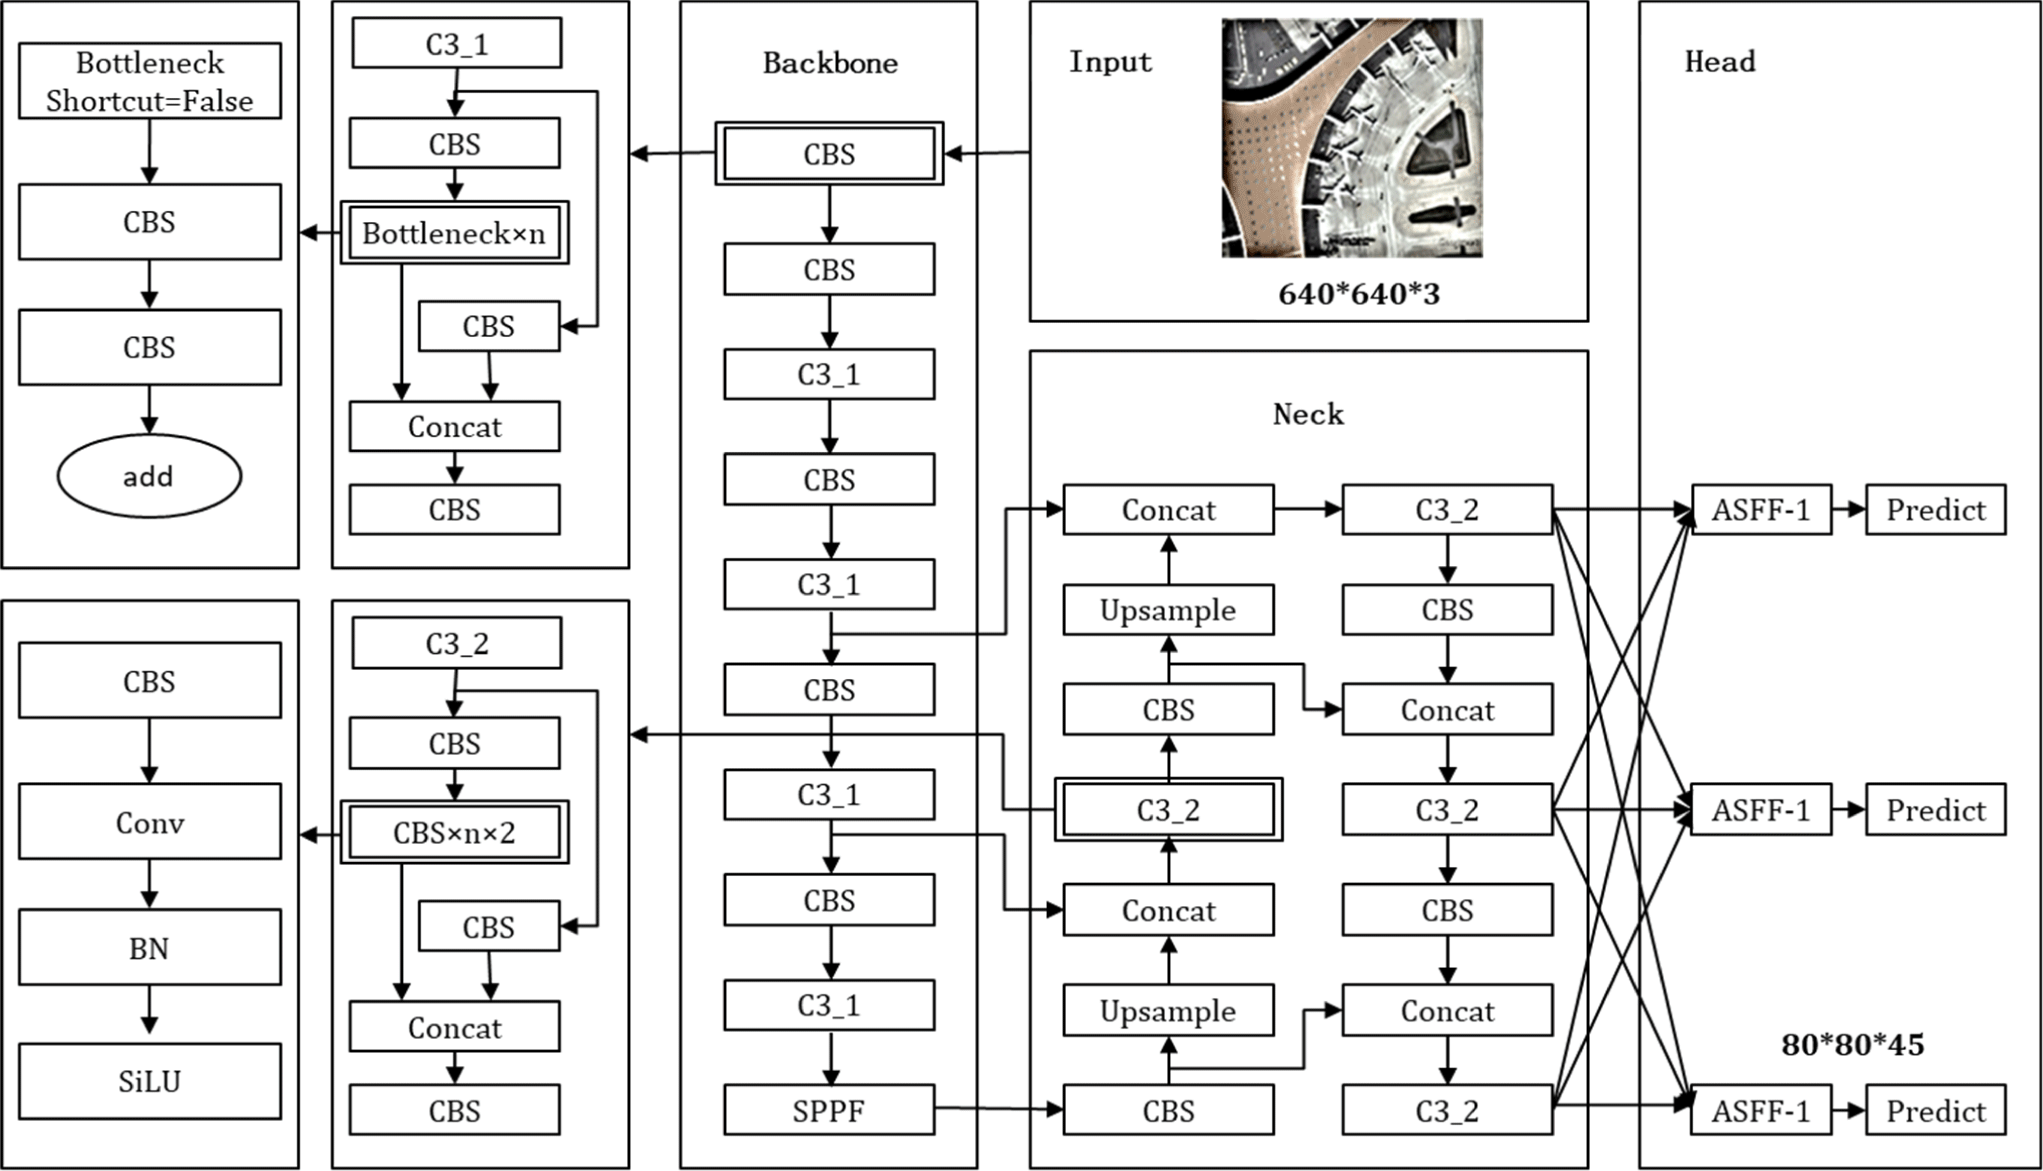
The YOLOv5n object detection network implements the PANet structure to enhance the merging of multi-scale feature maps. PANet introduces a bottom-up refinement structure, which builds upon the existing FPN framework. It departs from the original single-item fusion approach, adopting a two-way fusion method. This design aims to leverage both the high-level semantic information present in optical remote sensing images and the fine-grained details found at the lower levels, such as contours, edges, colors, and shapes.
To fully exploit these diverse sources of information, the network incorporates an adaptive feature fusion mechanism known as Adaptively Spatial Feature Fusion (ASFF). At the core of ASFF is the dynamic adjustment of weights during feature fusion across different scales. When combined with PANet, a fusion weight is learned for each layer scale. This adaptive weight allocation enables more effective utilization of features at different scales during the prediction of feature maps. Fig. 2 illustrates the structural framework of ASFF.
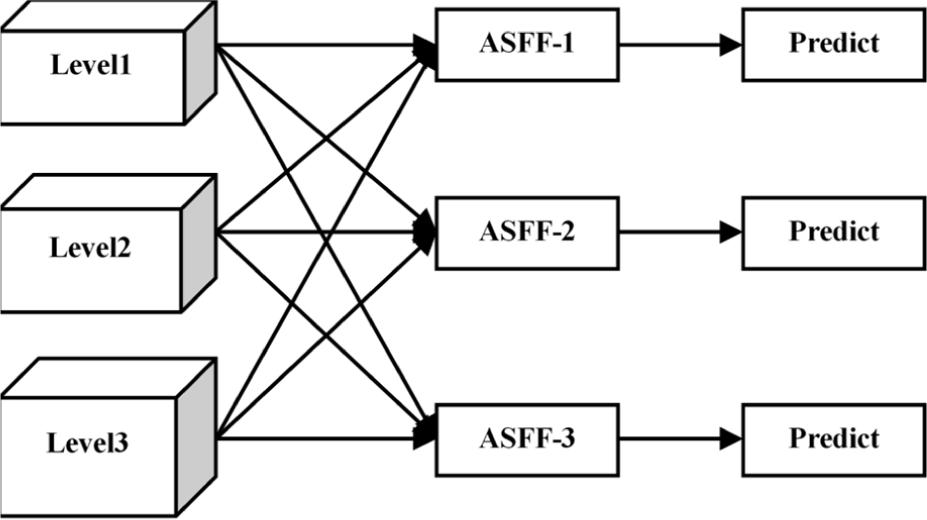
The feature fusion network output in YOLOv5n is the feature map of level1, level2 and level3. Taking ASFF-1 as an example, the fused output consists of semantic features from level 1, level 2, and level 3, along with the weight α obtained from different layers. β and γ are multiplied and added together. As shown in Equation (1):
Among them, are weights from different layers, are outputs from different feature maps. Since the scale of the object to be measured in the remote sensing image varies widely, by introducing the ASFF method to learn the fusion method of the parameters, other less useful hierarchical features can be filtered, and only the useful information of this layer can be retained, thereby improving the accuracy of object detection.
In computer vision tasks, the accuracy of object detection holds paramount importance, and this accuracy is significantly influenced by the choice of the loss function. In the original YOLOv5n detection algorithm, various metrics such as GIoU, CIoU, overlapping area, and aspect ratio are employed to calculate the loss function, primarily based on bounding box regression. However, a notable limitation of this approach is its failure to account for the direction mismatch between the predicted box and the ground truth box. This shortcoming leads to slower convergence and reduced efficiency in the training process.
To tackle this critical issue, Zhora introduces a novel loss function known as SIoU (Smoothed IoU). SIoU redefines the penalty metric by taking into consideration the vector angle between the required regressions. In the context of this paper, the original CIoU loss function is replaced with SIoU to enhance the efficiency of object detection.
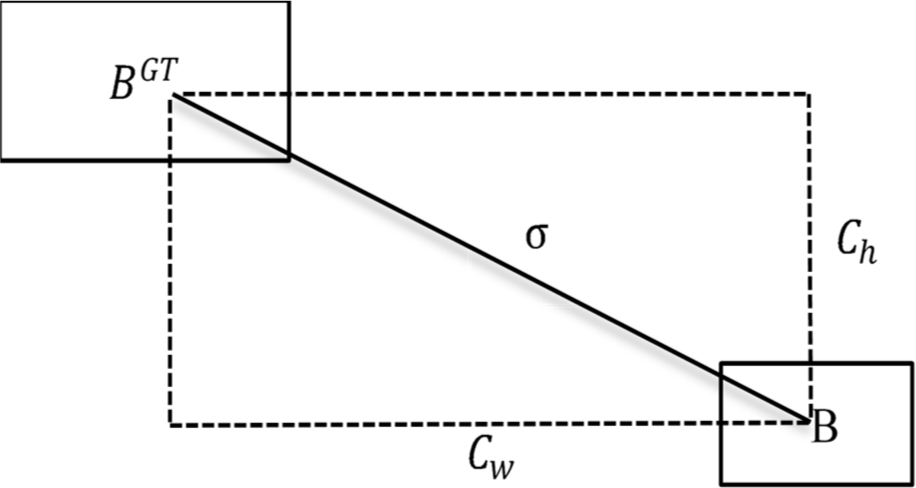
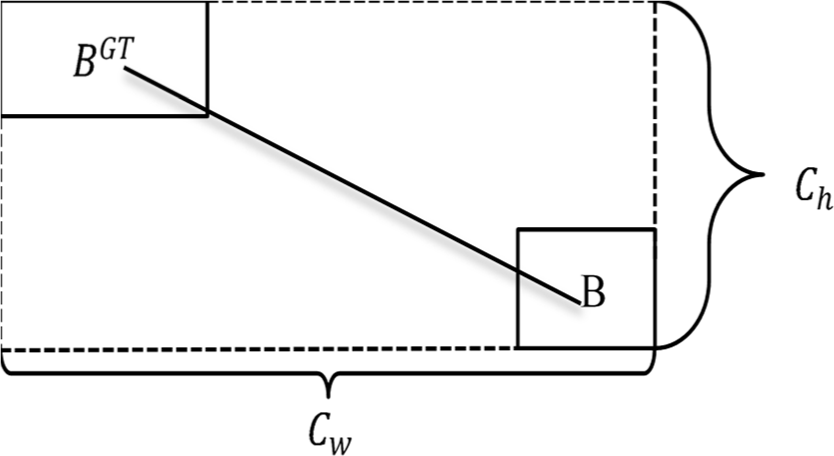
The SIoU loss function comprises four cost functions: angle cost, distance cost, shape cost, and IoU cost.
The purpose of incorporating the angle-aware loss function component with the angle loss is to reduce the uncertainty associated with distance-related variables. Essentially, the model will prioritize aligning the prediction with either the X or Y axis (whichever is closer) before minimizing the distance along the corresponding axis.
Angle cost calculation formula is as follows:
IV. EXPERIMENTAL DATA AND PROCESSING
The experimental data used for network model training in this paper comes from the RSOD dataset released by Wuhan University and NWPU VHR-10 dataset.
Before evaluating the model, it is very important to choose an appropriate evaluation metric.
The model’s accuracy is evaluated using the recall rate (R), precision (P), average precision (AP), and average mean precision (mAP) metrics in this paper; the model weight and network parameters are used to evaluate the complexity of the network model. The network model becomes more complex as the value of the two increases. The specific calculation method of each indicator is as follows:
This experiment is based on the Ubuntu 18.04 operating system, Intel (R) Xeon (R) Gold 5218 processor, 39G memory, 11 cores, using the Pytorch 1.8.0 framework, and a GeForce RTX 2080 Ti graphics card for network model training with 11GB of memory.
The Python version is 3.8 and the CUDA version is 11.1.1. The model training is set to 300 iterations with a batch size of 16. The learning rate is dynamically adjusted during the training process, and the NAG optimizer with a momentum of 0.937 is used for optimization. In the model training, the periodic learning rate is adjusted.
The experimental data used in the training of the network model in this study comes from the RSOD dataset [33] and NWPU VHR-10 [34] publicly available in China.
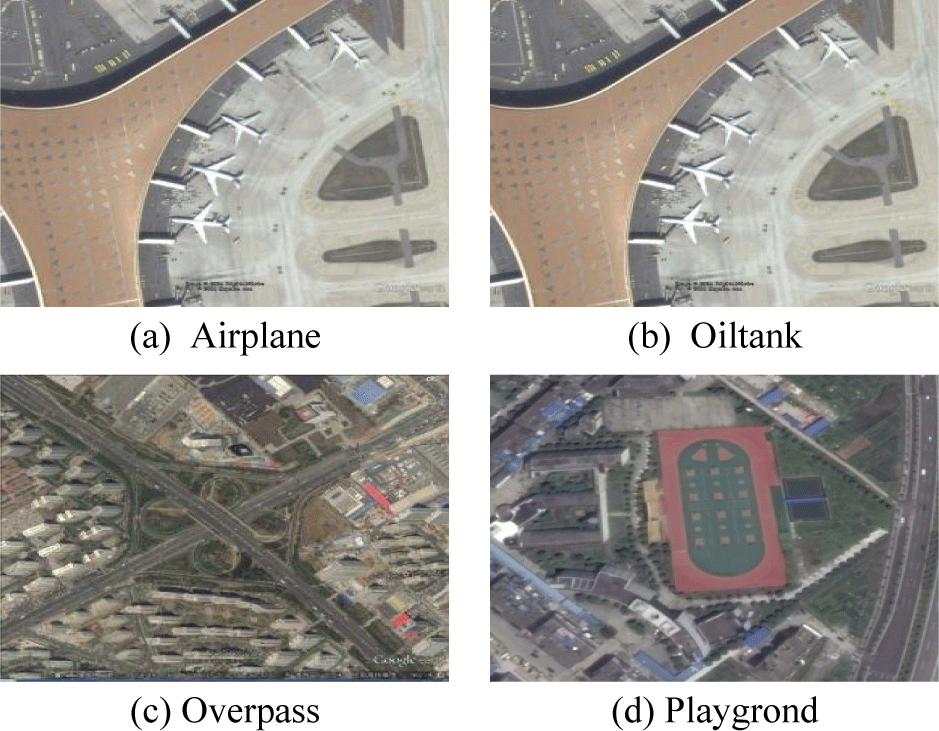
The dataset used in this experiment comes from the domestic public RSOD dataset. The RSOD dataset has a total of 2326 images, and the dataset images are from Google Maps. The remote sensing dataset contains four categories of aircraft, oiltank, playgrounds, and overpasses. Among them, there are 446 images of aircraft, including 4,993 samples of aircraft; 165 images of oiltank, including 1,586 samples of oiltank; 189 images of playgrounds, including samples of playgrounds 191; 176 overpass images, including 180 overpass samples; the rest are background images. The dataset is divided randomly into training, validation, and test sets in a ratio of 7:1:2 in this paper. Fig. 5 shows some example images from this dataset. Fig. 5 visualizes the training progress of image classification and detection on the dataset. Fig. 6 shows the visualization of the image classification and detection training situation of the dataset.
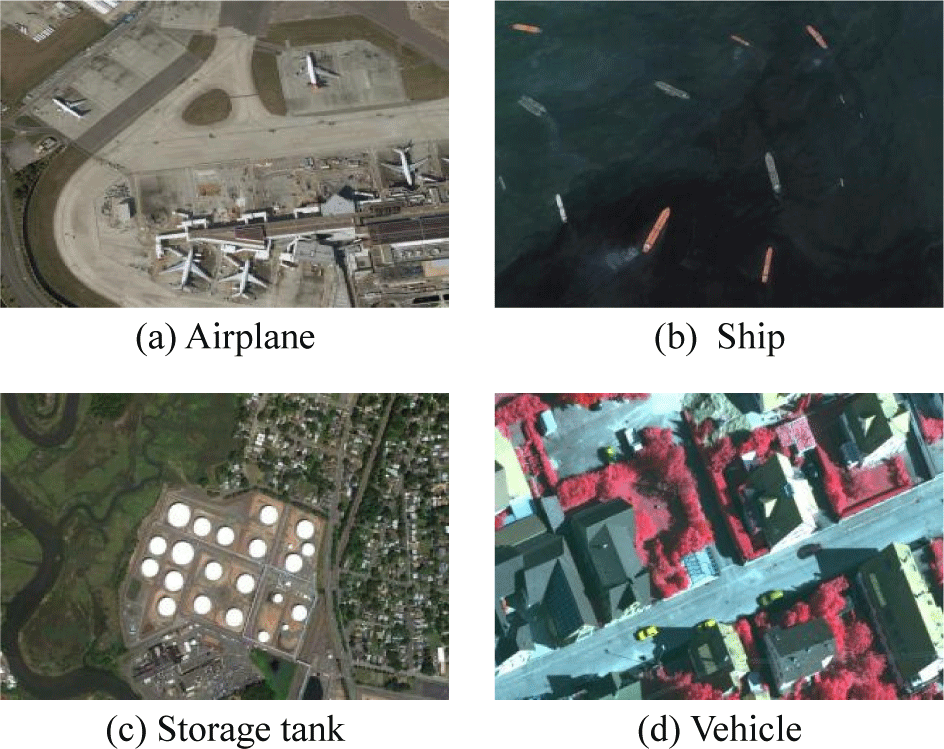
The second dataset used in this experiment comes from the public NWPU VHR-10 dataset. The dataset contains a total of 650 object images of 10 categories. The number of marked instances are 757 aircraft, 302 ships, 655 oil tanks, 390 baseball fields, 524 tennis courts, 159 basketball courts,163 track, field fields, 224 ports, 124 bridges and 477 vehicles. Fig. 7 shows some example images of the dataset.
V. EXPERIMENTAL RESULTS AND ANALYSIS
To assess the effectiveness of the AS-YOLOv5n algorithm introduced in this study, a series of experiments were conducted. These experiments involved comparing the AS-YOLOv5n with three other commonly used lightweight object detection algorithms. Additionally, the study sought to investigate the individual contributions of each module within the algorithms discussed in this paper. To achieve this, ablation experiments were performed, particularly focusing on the improved ASFF and SIoU loss function.
All of the aforementioned experiments were carried out using the RSOD dataset for training the network model. Throughout the experiments, various factors such as equipment control, training hyperparameters, and the number of iterations were kept as fixed parameters. Subsequently, the acquired experimental results were thoroughly analyzed.
To validate the effectiveness of AS-YOLOv5n, comparative experiments were conducted using three target detection networks: YOLOv5n, YOLOv5s, and YOLOv3-Tiny. These experiments were performed on both the RSOD dataset and the NWPU VHR-10 dataset. During the training process, efforts were made to maintain as much consistency as possible in the parameters across the four network models. The training comprised 300 rounds, with an initial learning rate set at 0.01. The resulting experimental outcomes are presented in Table 1.
| RSOD | AP1 | AP2 | AP3 | AP4 | mAP | ||||||
|---|---|---|---|---|---|---|---|---|---|---|---|
| YOLOv5n | 97.8 | 98.2 | 83.3 | 47.1 | 81.6 | ||||||
| YOLOv5s | 98.2 | 98.6 | 82.3 | 44.8 | 83.5 | ||||||
| YOLOv3-Tiny | 96.3 | 96.3 | 76.8 | 65.9 | 83.9 | ||||||
| AS-YOLOv5n | 98.2 | 97.5 | 86.8 | 57.2 | 84.9 |
Table 1 highlights the remarkable performance of the proposed AS-YOLOv5n detection method, achieving an impressive mAP of 84.9% and 86.7% on the two datasets, respectively. Notably, on the RSOD dataset, AS-YOLOv5n outperforms other methods, with YOLOv3 yielding the highest mAP among the alternatives. The Tiny method shows a 1% improvement over the lowest YOLOv5n method, and it exceeds the lowest YOLOv5n method by 3.3%.
On the NWPU VHR-10 dataset, AS-YOLOv5n also excels, surpassing YOLOv5s, which yields the highest mAP among other methods, by 0.1%. Furthermore, AS-YOLOv5n outperforms the lowest-performing YOLOv3-Tiny method by a significant margin, with a 5.7% higher mAP.
Moreover, AS-YOLOv5n exhibits favorable AP values for each remote sensing object category, as evident from Table 2. It’s worth noting that AS-YOLOv5n achieves these impressive results with considerably lower model parameters, weights, and computational resources compared to YOLOv5s and YOLOv3-Tiny. Furthermore, the time required to detect a single image is only 0.7 ms longer than YOLOv3-Tiny and 0.9 ms less than YOLOv5s.
| Methods | t/ms | Weight /MB | Gflops | Parameters |
|---|---|---|---|---|
| YOLOv5n | 5.2 | 3.75 | 4.2 | 1764577 |
| YOLOv5s | 6.3 | 13.8 | 15.8 | 7020913 |
| YOLOv3-Tiny | 4.7 | 16.6 | 12.9 | 8673622 |
| AS-YOLOv5n | 5.4 | 6.42 | 6.3 | 3135594 |
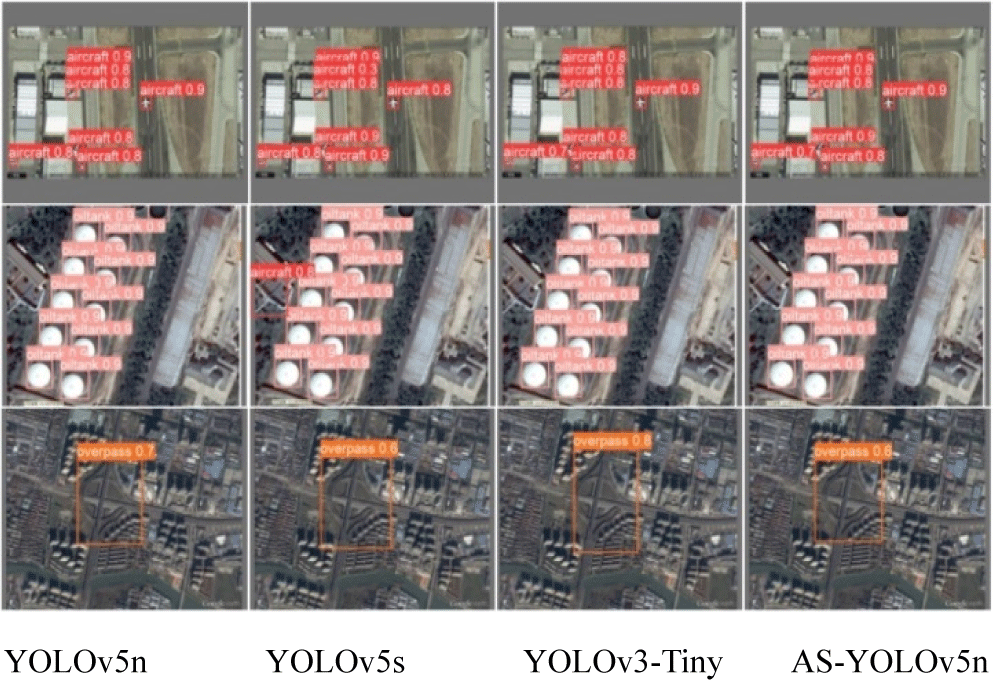
Combining Tables 1 and Table 2, it can be seen that compared with other lightweight detection methods, the experimental results on the RSOD data set and NWPU VHR-10 data set show that the AS-YOLOv5n remote sensing image detection method proposed in this study achieves the highest mAP value, and the detection speed, model weight, model parameter amount and calculation amount are all excellent. Experimental comparison and verification show that the detection method proposed in this article balances detection speed and accuracy well. The AS-YOLOv5n algorithm surpasses other algorithms in terms of mAP. It also has the characteristics of simplicity and is suitable for actual deployment needs. The visualization of the detection effects of the four models is shown in Fig. 8.
In order to verify the effectiveness of the introduction of the ASFF and SIoU methods proposed in this paper, three sets of experiments were compared. Table 3s and Table 4 present the results of ablation experiments conducted on the RSOD dataset, evaluating the performance of three different methods, Table 5 record the results of ablation experiments on the NWPU VHR-10 dataset, and obtain the comparison results of accuracy and network model complexity.
| Methods | mAP | AP1 | AP2 | AP3 | AP4 |
|---|---|---|---|---|---|
| YOLOv5n | 81.6 | 97.8 | 98.2 | 83.3 | 47.1 |
| YOLOv5n+SIoU | 82.5 | 98.5 | 97.7 | 82.5 | 51.4 |
| AS-YOLOv5n | 84.9 | 98.2 | 97.5 | 86.8 | 57.2 |
| Methods | t/ms | Weight/MB | Gflops | Parameters |
|---|---|---|---|---|
| YOLOv5n | 5.2 | 3.75 | 4.2 | 1764577 |
| YOLOv5n+SIoU | 5.0 | 3.75 | 4.2 | 1764577 |
| AS-YOLOv5n | 5.4 | 6.42 | 6.3 | 3135594 |
As shown in Table 3s and Table 5: After changing the loss function in the original YOLOv5n network model to SIoU, mAP increased the performance by 0.9% and 0.7% on the two data sets respectively. On this basis, we continued to introduce adaptive After the feature fusion method, the overall effect has been greatly improved, and the mAP value has increased by 2.4% and 4.0% respectively. As shown in Table 4, after improving the loss function, the model complexity did not change, but the detection speed was improved, and the single detection time was shortened by 0.2s. After the adaptive feature fusion method was introduced, the weight of the model increased by 2.67 MB. When the calculation amount and parameters are nearly doubled, the detection time of a single image only increases by 0.2 ms. It can be seen from Table 3 and Table 4 that after the SIoU loss function is introduced, the complexity of the model does not change, but the detection speed and detection accuracy are improved, indicating the effectiveness and advancement of the improved method. This shows that replacing the CIoU loss function of the original YOLOv5n with the SIoU position box regression loss function has been effectively verified; in addition, after the adaptive feature fusion method was introduced, the mAP obtained in the experiment and the AP value of each remote sensing target have greatly improved. The improvement, as shown in Table 5, also effectively verifies that the introduction of the adaptive feature fusion method has good performance in detecting objects of different scales in remote sensing
IV. CONCLUSION
This paper presents a lightweight optical remote sensing image detection method based on an improved version of YOLOv5n. The method encompasses three key enhancements:
Firstly, it integrates ASFF into the YOLOv5n network structure, bolstering the network’s capability to fuse features across different scales.
Secondly, the loss function of YOLOv5n is upgraded to the advanced SIoU, contributing to improved detection accuracy.
Finally, the proposed algorithm undergoes rigorous testing on a remote sensing image dataset and is benchmarked against three lightweight algorithms: YOLOv5n, YOLOv5s, and YOLOv3-Tiny. The experimental results clearly demonstrate that the enhanced network excels in accurately and efficiently detecting variations in remote sensing images.
Importantly, the proposed method significantly reduces errors and omissions compared to the original YOLOv5n algorithm. It outperforms traditional object detection algorithms in terms of detection speed, network model size, and accuracy. This method effectively addresses the challenges associated with remote sensing image detection, particularly erroneous and missed detections arising from scale variations.
Furthermore, this method fulfills the requirements for real-time and rapid detection of remote sensing objects, making it suitable for applications with limited computing resources and high-speed detection. It finds promising applications in scenarios like ocean search and rescue, maritime intelligence, reconnaissance, and early warning.


