I. INTRODUCTION
Computer science, especially image processing algorithms, are currently being utilized extensively across various fields, yielding fruitful results. Generating large-scale images, particularly creating mosaic images, involves aggregating multiple smaller images to form a single large image, a process that is applicable in many contexts. In our research project, we have explored different approaches to evaluating the effectiveness of mosaic creation with the aim of mitigating environmental degradation through increased surveillance.
The first phase of this work is to compare different methods of creating large-scale mosaics using many small images. The main goal of the mosaic method is to combine many small items to create one large picture or mosaic. Additionally, given the complexity of mosaic creation methods, the selection of appropriate algorithms for mosaic creation is critical. Moreover, as mosaic creation often involves a significant number of images, extensive computational resources and time are required. Therefore, selecting suitable algorithms capable of producing accurate results within a reasonable timeframe is paramount. Consequently, in our current research, we have carefully selected and evaluated algorithms that are most suitable for both image processing and analysis tasks. Our study is relevant to researchers in the field of computer science. For example, works such as [1-3] investigate mosaic creation by selecting images acquired from the air and processing them for surveillance purposes. Similarly, research studies such as [4-6] focus on using mosaic creation algorithms to process images captured from surveillance cameras. Furthermore, the utilization of algorithms such as FAST and FREAK for rapid image processing and mosaic creation is explored in studies like [7-8].
In the second part of this paper, we discuss the algorithms utilized for large-scale image creation and mosaic generation, as well as our own implementation efforts. In the third section, we provide a detailed description of the comparative results obtained from these experiments.
II. RESEARCH METHODLOGY
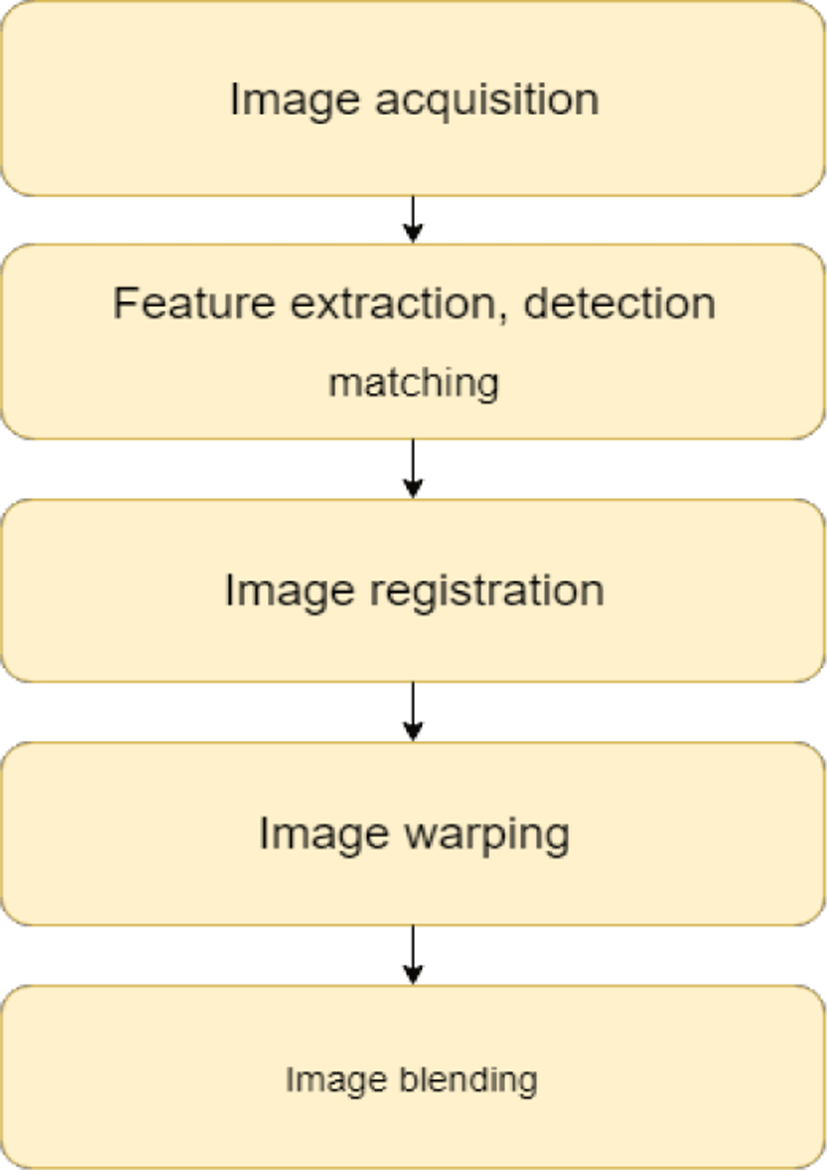
In this section, we will provide a detailed explanation of the algorithms utilized for the creation of large-scale images or mosaics at both the mosaic creation stage and the subsequent refinement stage, focusing on the principles and procedures of their application (Fig. 1).
By elucidating the intricacies of these algorithms, we aim to establish a direct correlation between the outcomes of mosaic creation and the algorithms utilized for both refinement and optimization.
MSER is an algorithm that identifies stable regions within an image. Its primary function is to locate corresponding points between two or more identical or similar objects obtained from different perspectives. The core operation of the MSER algorithm revolves around identifying regions that remain stable across different scales. It achieves this by iteratively segmenting the image into multiple smaller regions and merging adjacent regions until the resulting area reaches a maximum size, with each region bounded by a minimum and maximum threshold. The rate of area growth is monitored, and when it reaches zero, it indicates the presence of an extremal region [10].
SURF is an algorithm widely utilized for both detecting and describing salient features within images, known as blobs. The detection of these salient features relies on the computation of the Hessian matrix. The Hessian matrix is calculated at each pixel location to measure local variations in intensity, with a detector selecting salient points by identifying local maxima [11]. Additionally, the Hessian matrix is employed in scale selection for images. For a given pixel (x, y), the Hessian matrix H (x, σ) is represented as follows at scale σ.
Here, L (x, σ) represents the convolution with the second derivative of the Gaussian at point x, where a Gaussian function with a standard deviation of σ is convolved at the given position (x, σ).
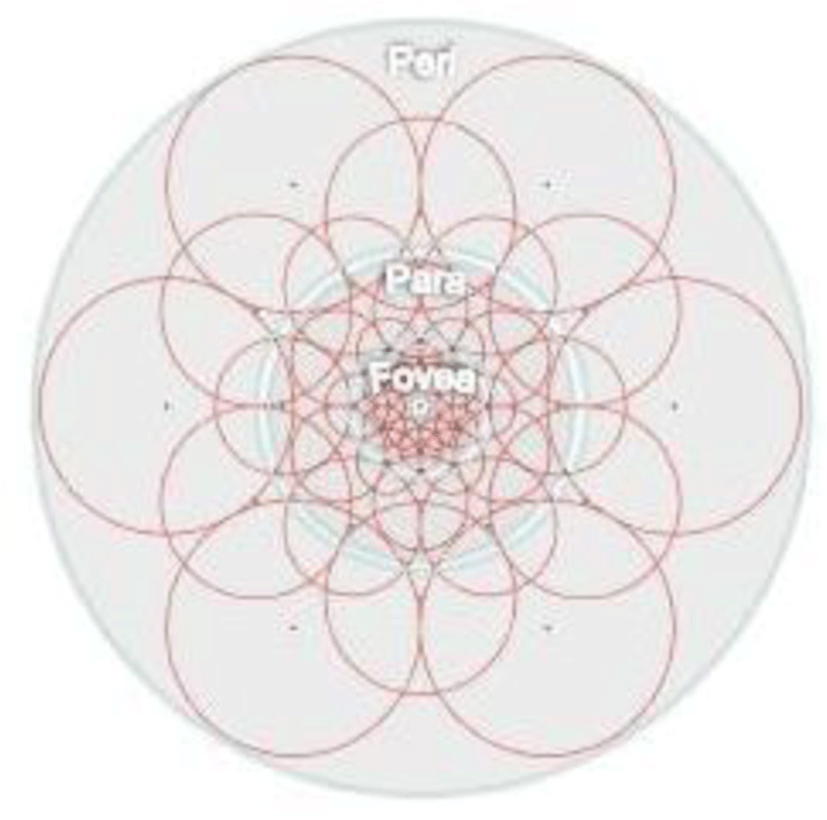
The FREAK algorithm is utilized for robust feature detection and is particularly adept at discerning human-eye-like patterns. This methodology focuses on identifying regions of interest that are densely populated and employs a novel approach to selecting salient points. By initially performing a coarse-level shift and subsequently refining the search space with specific thresholds, the algorithm achieves nuanced feature extraction within the human eye’s operational range (Fig. 2) [10]. Advantage: Identifying significant features regardless of image size and resolution.
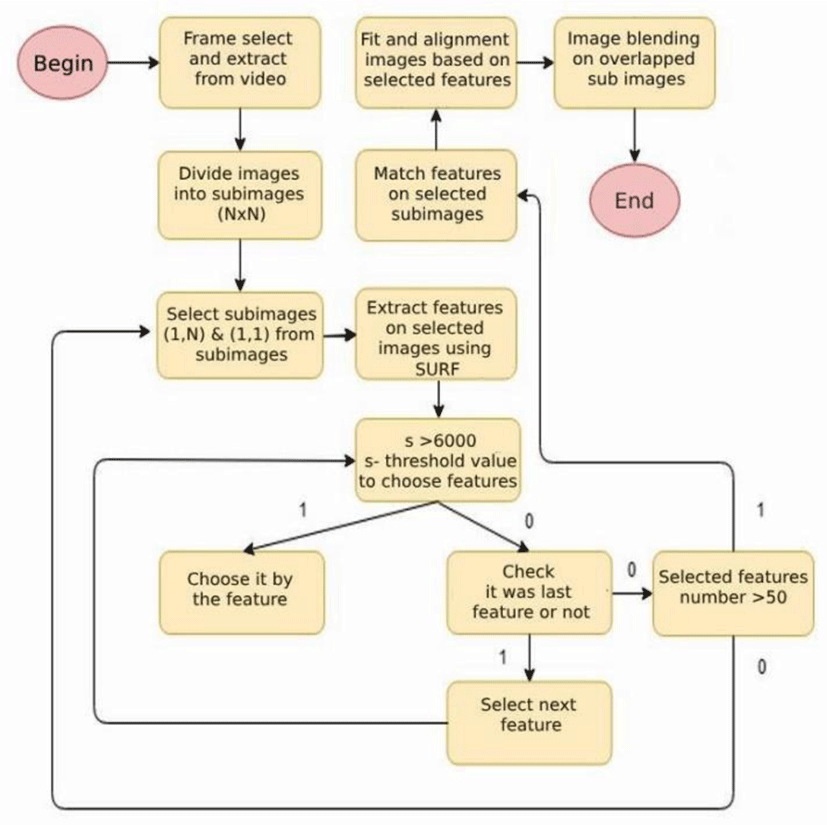
Since the phase of feature detection from the image plays an important role in mosaicking, we aim to extract a certain number of features with the best possible results in this proposed method. In other words, when detecting features from an image, not for the whole image, but by dividing the images to be mosaicked into regions, selecting the features in that region with a threshold value (over 6,000) and matching the next image to be mosaicked with the corresponding region. Higher threshold values result in fewer keypoints being detected, but they tend to be more reliable and robust. This can help reduce computational overhead and improve the quality of the keypoints detected.
If the number of features in the states is less than 50, considering the images being mosaicked, it continues by moving to the next state. The fewer keypoints may be suitable for specific applications where computational efficiency is paramount. We chosen 50 in this work (Fig. 3).
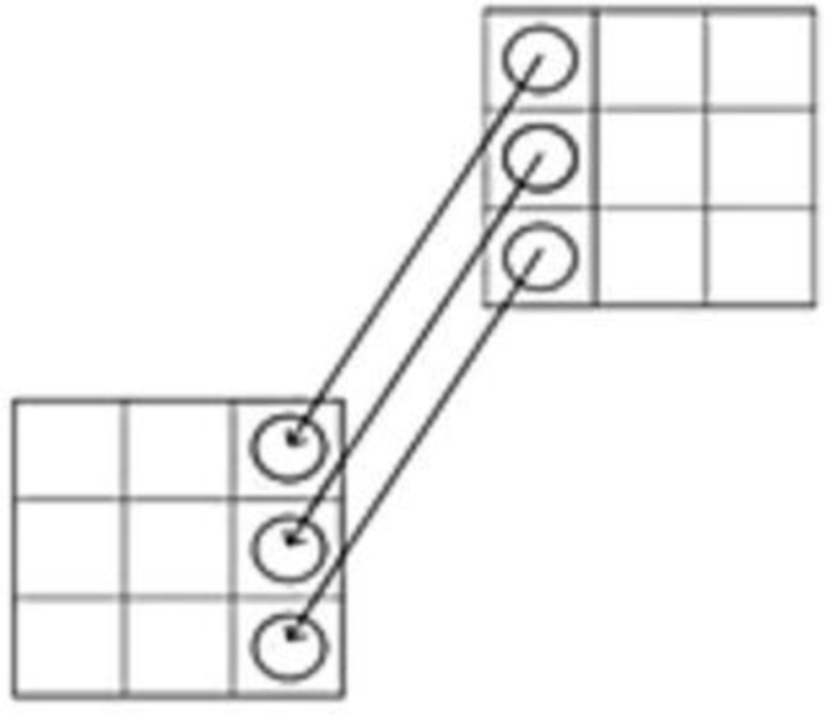
For instance, the illustration above demonstrates the division of two images into regions and the subsequent connection of these regions for feature matching, indicated by straight lines (Fig. 4).
III. EXPERIMENTAL RESULTS
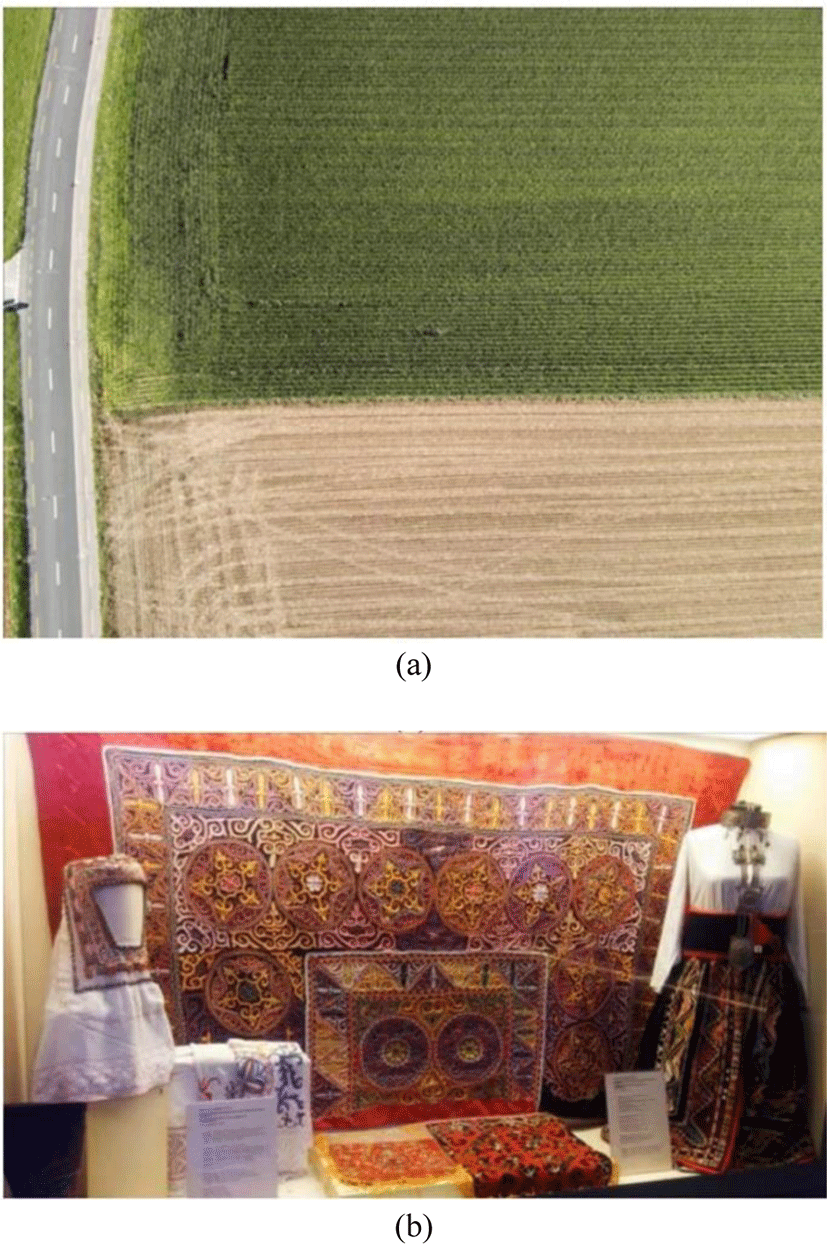
The study was conducted using a dataset consisting of 150 images captured by a drone provided by Sensefly company [12], and the next data we created, we intended to create one image from 100 pieces of images, with 10×10 grid position. In the primary section denoted as A within the results section, a comprehensive comparison was conducted, analyzing the performance of various feature detection and extraction algorithms applied to the images (detection+extraction). Subsequently, in the section B, our proposed methodology was evaluated in comparison to the traditional approach of full-image feature detection utilized in previous research studies.
For image processing and analysis, MSER, SURF, and FREAK algorithms were incorporated using the provided table format (Tables 1 and Table 2) and they evaluated based on the following criteria. The following two metrics are used to evaluate the resulting image compared to the original image.
-
Mean Square Error (MSE): Measures the average squared error.
-
Peak Signal-to-Noise Ratio (PSNR): Measures the ratio between the maximum possible power of a signal and the power of corrupting noise.
| Algorithm | MSE | PSNR |
|---|---|---|
| MSER+FREAK | 53.4852 | 30.8485 |
| MSER+SURF | 53.1403 | 30.9560 |
| SURF+SURF | 52.1775 | 30.6381 |
| Algorithm | MSE | PSNR |
|---|---|---|
| MSER+FREAK | 115.9947 | 27.4864 |
| MSER+SURF | 115.2506 | 27.6332 |
| SURF+SURF | 112.1387 | 27.5144 |
Evaluation results are shown in Tables 1 and Table 2.
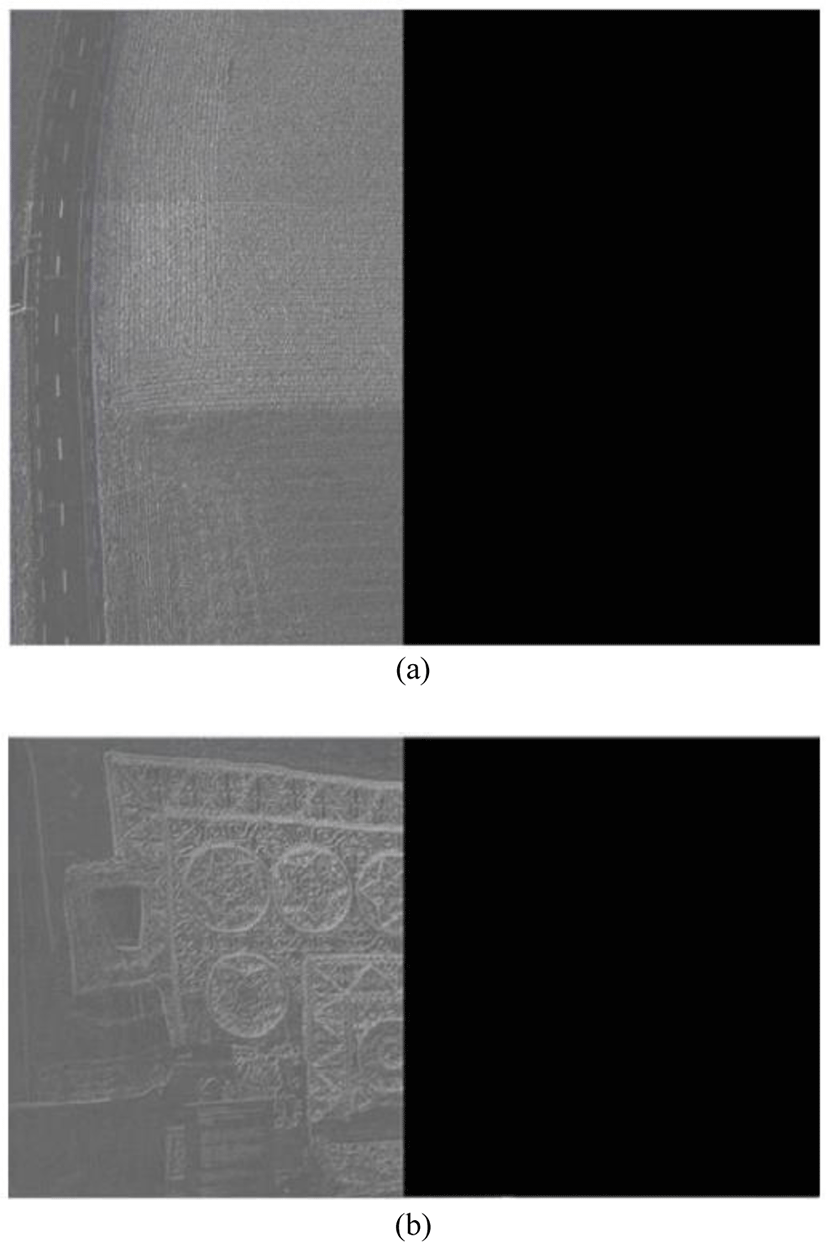
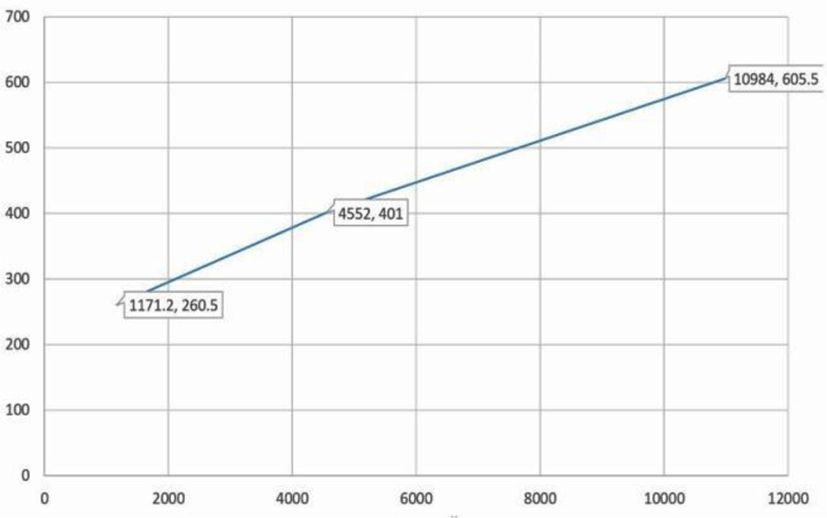
By the comparison result, we decided to choose combination of (SURF+SURF). In Fig. 6, we illustrate the difference between the reference image and the generated image. Due to the small difference, the comparison appears dominantly black. To show this difference, we preformed histogram equalization on the left side. As mentioned above, when the number of features in the given image increased, the calculation time increased and the running time slowed down. For Fig. 7, the graph below shows the relationship between the number of features detected and the running time when the mosaiced images overlap by 10%, 25%, and 50%.
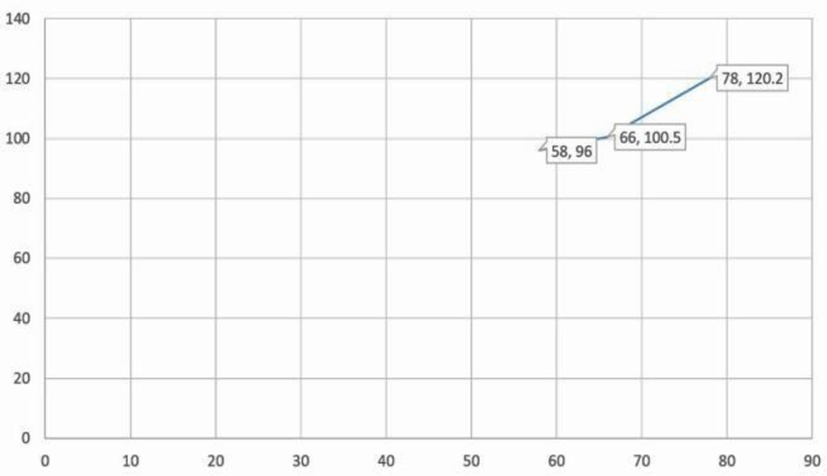
Considering the more favorable results observed in the previous section’s analysis, we have opted for the SURF+SURF variant. Utilizing our approach of segmenting the entire image into specific regions and conducting feature comparisons among them, the following results have been obtained.
As illustrated in Fig. 8, there has been a significant reduction in processing time, decreasing from 605.5 seconds to 120.2 seconds. Furthermore, Table 3 suggests that the comparison estimates closely align with the previous results.
| Algorithm | MSE | PSNR |
|---|---|---|
| SURF+SURF (Fig. 5(a)) | 53.1532 | 30.6152 |
| SURF+SURF (Fig. 5(b)) | 115.1874 | 27.1452 |
IV. CONCLUSION
Within this study, various mosaicing methods were evaluated and compared for their applicability in the research domain of “monitoring plant growth using digital image processing.” Notably, the SURF algorithm demonstrated superior performance. Subsequently, we devised a novel approach wherein the image was partitioned into regions, and the SURF algorithm was applied to these regions. This strategic segmentation not only reduced computational complexity but also led to a significant reduction in processing time, averaging a threefold decrease. Importantly, this optimization did not compromise the quality or integrity of the final mosaicked image.
Given the efficacy demonstrated by our proposed methodology, we have elected to employ it in our ongoing research project.

