I. INTRODUCTION
Recently, emotion recognition technology has been applied to various fields to provide personalized services based on the user’s emotional state. For example, some music streaming services analyze the user’s emotional state and recommend appropriate music. Specifically, if a user is feeling stressed or depressed, they will recommend calm music, and if a user is in a good mood, they will recommend energetic music. Modern cars are also equipped with technology that recognizes the driver’s emotions. By analyzing the driver’s facial expressions or voice, the car provides a comfortable driving experience by sending warnings when the driver is tired or stressed, or automatically adjusting the seat or temperature to create a more comfortable driving environment [1-3]. As emotion recognition technology is being used in various fields to provide personalized services, many researchers are conducting research on emotion recognition technology.
Emotion recognition can be categorized into verbal and non-verbal methods based on the modality of the input data [4]. Verbal approaches recognize the user’s emotions from what the user says, i.e., voice or text. These methods often analyze speech patterns, tone, pitch, and word choice to infer emotional states. Non-verbal approaches recognize the user’s emotions from non-verbal factors such as the user’s electroencephalography (EEG) [5], heart rate [6], and facial expressions [7-9]. Unlike verbal methods, non-verbal approaches can capture more subtle, involuntary emotional cues that are not influenced by the individual’s language, making them particularly useful in situations where verbal communication is limited or unavailable, such as in noisy environments or with non-verbal individuals.
In this study, we focus on the nonverbal emotion recognition from face images, because emotions expressed in facial expressions can be interpreted universally regardless of language or culture, whereas emotions expressed in speech and text can be interpreted differently depending on language and culture. Therefore, when performing speech or text-based emotion recognition, it is difficult to consider both language and cultural factors [10]. In this study, we chose to use face images among various non-verbal modalities for the following reasons. The results of EEG and heart rate can be affected by the user’s physiological state, and measuring EEG or heart rate requires the user to wear a sensor, which is inconvenient. In comparison, face images can be easily collected using a camera without the inconvenience of wearing sensors. Furthermore, facial expressions are often the most direct and visible indicators of a person’s emotional state, and they can convey emotions even in the absence of speech or text. This makes face image-based emotion recognition a versatile and non-intrusive method, suitable for a wide range of real-world applications, such as in surveillance, human-computer interaction, and mental health monitoring.
Over the past few decades, various studies have been conducted on facial emotion recognition (FER) techniques. Many of the existing studies utilize facial landmarks to extract features for emotion recognition from face images [11-13]. In these studies, local changes (e.g., eye or lip movements) in face images according to emotional states were proposed to be designed as features for emotion recognition using landmarks. However, landmark-based facial features focus on local changes and do not contain enough global information in the face image, which may limit the accuracy of emotion recognition that can be achieved [14]. In addition, landmark-based approaches may struggle to capture more subtle, complex facial expressions that involve broader facial regions. In this study, we investigated how to overcome the limitations of existing landmark-based techniques and improve the recognition performance of FER techniques by incorporating both local and global facial features. Our approach aims to capture more comprehensive facial information, allowing for a more accurate and robust emotion recognition system. The main contributions of this work can be summarized as follows:
-
To leverage both local and global facial information for emotion recognition, we propose the extraction of contour and wrinkle patterns from facial images and use them as features for FER. These contour and wrinkle patterns are crucial, as they provide valuable cues that reflect subtle changes in facial expressions, which are essential for accurately identifying emotions.
-
To demonstrate the effectiveness of the proposed features, we conducted a performance evaluation of four machine learning (ML) models using two publicly available FER datasets. The experimental results show that all four ML models achieved state-of-the-art performance on the test set when trained with the proposed features.
This paper is organized as follows: Section II contains a review of existing research related to this work. Section III describes the methodology proposed in this study. Section IV presents the performance evaluation results. Section V concludes this study.
II. RELATED WORKS
Over the past few decades, research on FER techniques has been steadily progressing, and various techniques have been utilized to achieve high emotion recognition accuracy. For example, in [15], Y. Shin proposed a FER technique utilizing whitening transformation and principal component analysis (PCA). The proposed technique first detects the face region in the original image and resizes it to 20×20 pixels. Then, the whitening transformation is applied to the 20×20 face image to obtain a face image that is robust to illumination. Next, the principal components are obtained using PCA, and the face image is restored using 200 principal components out of the remaining 399 components, excluding the first principal component out of the total 400. According to Y. Shin, the reason for excluding the first principal component is that it does not reflect subtle changes in facial expressions, and restoring the face with the first principal component excluded ensures that subtle changes in facial expressions are well represented in the restored face image. The restored face images are then converted into one-dimensional vectors and used as input data for the FER task. In the experiment, a multi-layer perceptron with one hidden layer consisting of 30 nodes was used, and the emotion recognition results were close to 100% of human judgment results.
In [16], Bae et al. proposed an emotion recognition technique that uses the Euclidean distance between 68 points constituting facial landmarks as a feature vector. The dimension of the initial feature vector was 2,278 (=68×67/2), and 90 features were selected for emotion recognition using a genetic algorithm. According to the experimental results, the features calculated from the landmarks in the mouth and eye areas were found to be the most useful for emotion recognition.
In [17], Ahmed et al. proposed using a feature called compound local binary pattern (CLBP), which can extract and include more texture information from face images than the traditional local binary pattern (LBP) for emotion recognition tasks. Experimental results showed that support vector machine (SVM) models trained with CLBP outperformed those trained with traditional LBP. Ahmed et al. analyzed the experimental results and concluded that CLBPs are able to include richer texture information than traditional LBPs by considering both the difference between a pixel and its neighbors, as well as its size.
In [18], Sisodia et al. clustered face images by emotion using the k-means clustering algorithm and classified the emotions using an SVM model. For this purpose, a Gabor filter was used to extract the main features from the face images. Motivated by the results of [18], Song et al. compared the emotion recognition performance of different types of edge detection filters used to extract features from face images in [19]. Four filters were considered: the Laplacian filter, Sobel filter, Scharr filter, and Canny edge detection filter. Korean face datasets published on AI Hub were utilized, and VGG-16 [20] and ResNet-50 [21] models were used as baseline models. According to the experimental results, the highest emotion recognition accuracy was achieved when the Scharr filter was applied, and the lowest accuracy was achieved when the Laplacian filter was applied.
According to Khan in [22], existing FER research has been dominated by methods that utilize hand-crafted features such as texture, geometric features, and facial landmarks. However, more recently, convolutional neural network (CNN) models have been widely used because of their superior performance in automatically extracting high-level features. For example, in [23], Shahzad et al. used pre-trained CNN models such as AlexNet and VGG-16 to extract features for emotion recognition from facial images. Then, SVM models and ensemble classifiers were trained using the features extracted by CNN to perform FER.
While previous FER studies extracted and used features containing texture information, such as LBP, CLBP, and Gabor filters, this study applies the Canny edge detection operator to face images to emphasize contour and wrinkle information, and extracts and utilizes histogram of oriented gradients (HOG) features from edge-detected images to improve the emotion recognition performance of ML models. This approach is expected to capture both local and global facial features, which are critical for recognizing subtle emotional expressions that might be overlooked by methods focusing solely on texture. Regarding the proposed features, the specific extraction process is described in the next chapter.
III. PROPOSE METHOD
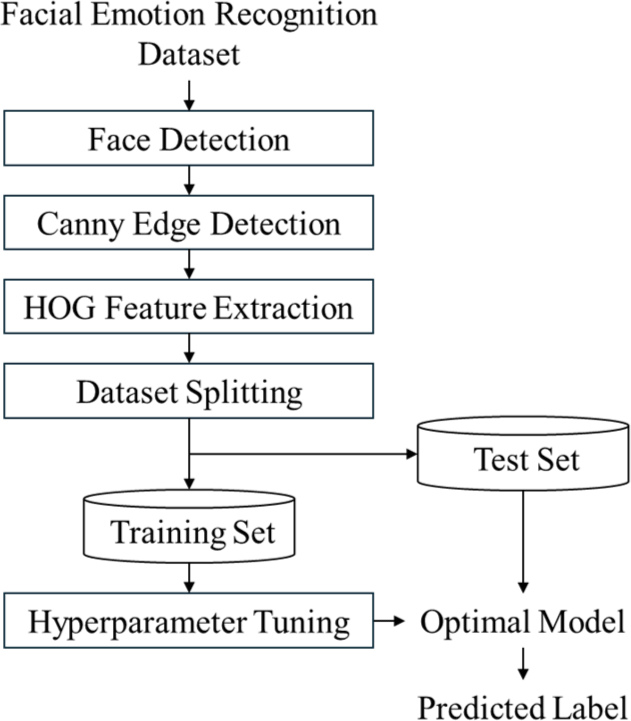
Fig. 1 shows the overall process of the FER method proposed in this study. The entire process is divided into four main stages: (1) face detection, (2) Canny edge detection, (3) HOG feature extraction, and (4) hyperparameter tuning.
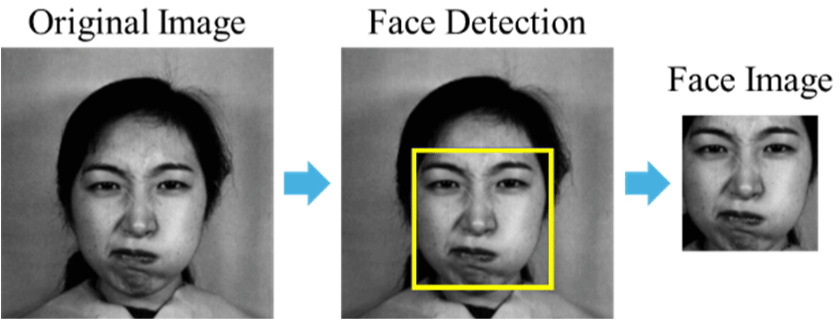
The original image may contain various factors such as background, obstacles, and other body parts in addition to the face. If the input image includes information about the background or other body parts, the ML model may learn unnecessary variables, which could reduce the accuracy of emotion recognition. This issue, known as ‘noise’ in the data, can lead to overfitting and hinder the model’s ability to generalize well. Therefore, in the proposed method, as shown in Fig. 2, only the face region is extracted from the original image, allowing the ML model to focus solely on the face without being influenced by unnecessary background or other elements. By isolating the face, we ensure that the model can learn the most relevant features for emotion recognition, improving both its efficiency and accuracy.
In this study, the get_frontal_face_detector() class from the dlib library was used to detect and extract faces from the original images. At this stage, the size of the extracted face images may vary for each original image in the dataset. Such variation in image size can introduce inconsistencies and make it difficult for the ML model to process the images effectively. Therefore, as part of the preprocessing step, the proposed method resizes the extracted face images to a fixed size of 64×64 through a resizing process. This resizing ensures uniformity across all face images, helping the model to learn consistent features and improving the overall performance of emotion recognition.
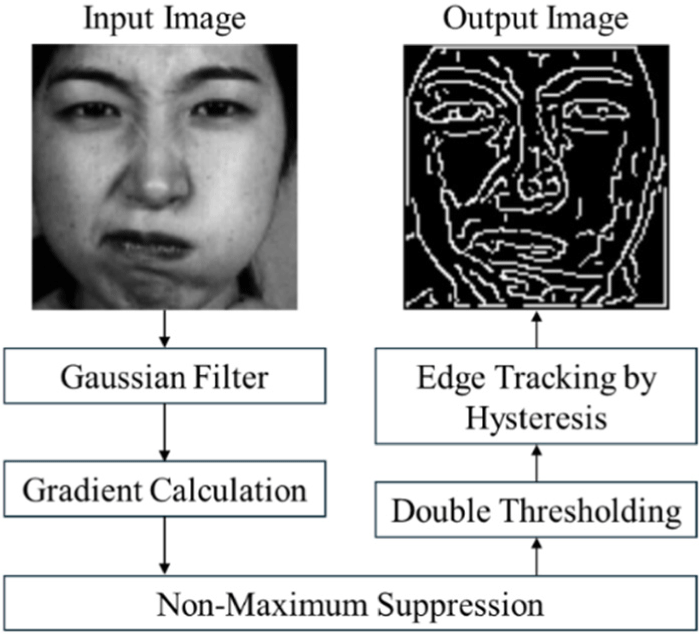
In this study, to extract contour and wrinkle information from the detected face images and use it as features for emotion recognition, the Canny edge detection operator is applied to the face images. Fig. 3 shows the procedure of the Canny edge detection algorithm.
-
Step 1) Gaussian Filter: Images generally contain noise, which can interfere with edge detection. Therefore, a 5×5 Gaussian filter is first applied to the face image to remove noise. This step helps smooth the image and reduces the likelihood of detecting false edges due to random variations in pixel intensity.
-
Step 2) Gradient Calculation: Next, the edge strength of each pixel in the image is calculated. To emphasize the edges, the Sobel filter is used to compute the gradient in both the horizontal and vertical directions. The gradient calculation highlights areas with rapid intensity changes, which are likely to correspond to edges in the image.
-
Step 3) Non-Maximum Suppression: To accurately identify the location of the edges and sharpen the final edges by removing blurred edges in the middle, each pixel is compared with its two neighboring pixels in the gradient direction. Only the pixel with the highest intensity is retained, and the others are set to 0. This step ensures that the edges are thin and precise, which is crucial for accurately identifying the contours and wrinkles that convey emotional expression.
-
Step 4) Double Thresholding: Two threshold values are set to distinguish between strong edges, weak edges, and non-edges, allowing for more accurate edge identification. By differentiating strong and weak edges, this step improves the detection of significant contours while minimizing noise.
-
Step 5) Edge Tracking by Hysteresis: Weak edges connected to strong edges are considered valid edges, while weak edges that are not connected to strong edges are discarded. In other words, weak edges that are continuously connected to strong edges are tracked to expand the edges. This process generates a binary image in which the boundaries (contours, wrinkles) of the face are clearly detected. By preserving continuous, meaningful edges and discarding isolated weak edges, the hysteresis step helps produce a more reliable and accurate representation of the face’s features, which are essential for emotion recognition.
In this study, the Canny() function from the OpenCV library was used to detect edges in the face images. The output image from the Canny edge detection operator is a binary image, as shown in Fig. 3, where the edge areas are represented in white (1) and non-edge areas in black (0). Through the Canny edge detection operator, contour and wrinkle information in the face image can be represented as edges. These edges correspond to important facial features, such as the boundaries of facial regions, wrinkles, and the contours of facial expressions, which are key to identifying emotional states. By isolating these edges, the model can focus on the most relevant visual cues, reducing the impact of background noise and other irrelevant details that may hinder accurate emotion recognition.
In the proposed FER method, the Canny edge detection operator is used to detect contour and wrinkle information in the face image based on emotional state. Then, the contour and wrinkle information within the face is quantified as HOG features. The HOG captures the distribution of edge directions and intensities over localized regions of the image, which are essential for recognizing subtle changes in facial expressions. By encoding the spatial patterns of edges, HOG features provide a robust representation of the face’s shape and texture, making them highly effective for emotion recognition, especially in differentiating complex and subtle emotional states.
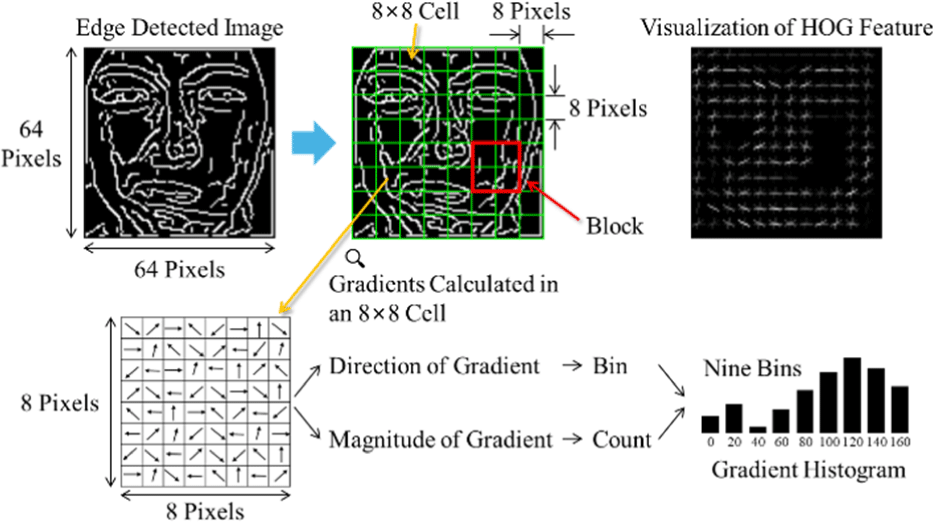
Fig. 4 shows the process of extracting HOG features from the edge-detected image. First, the edge-detected image, with a size of 64×64, is divided into cells of 8×8 pixels. As a result, 8 cells are created in the horizontal direction and 8 cells in the vertical direction, giving a total of 64 cells (=8×8) in the image. Then, the gradient is calculated for each cell. For each of the 64 pixels in a cell, the gradient is categorized based on its direction component into nine bins, with intervals of 20° from 0° to 180°. This creates a gradient histogram consisting of nine bins. The height (count) of each bin is calculated using the gradient magnitude component of the 64 pixels in the cell.
In this study, two adjacent cells in the horizontal and vertical directions—i.e., a total of four cells—are defined as a single block. In other words, as shown by the red rectangle in Fig. 4, each block consists of 4 cells, and each cell contains gradient histogram information with 9 bins. Therefore, from one block, a total of 36 (=4 cells×9 bin height values/cell) numeric values of the gradient histogram can be extracted. By shifting the block one cell at a time, either horizontally or vertically, a new block is defined. In a 64×64 eye region image, a total of 7 blocks can be created in the horizontal direction and 7 blocks in the vertical direction. As a result, a total of 49 (7×7) blocks are generated. Therefore, the total number of numeric values extracted from the gradient histograms of all blocks in the eye region image is 1,764 (=49 blocks×36 numeric values/block). These 1,764 numeric values are then used as HOG features for FER in this study.
The extracted HOG features are used as the input vector for the ML model. The model is then trained to predict the emotion class based on the given input vector. During the training process, hyperparameters are tuned to optimize the model’s performance. Hyperparameter tuning is crucial for ensuring that the model generalizes well and performs efficiently on unseen data. In this study, the GridSearch() class from the scikit-learn library is used to find the optimal hyperparameter configuration by exhaustively searching through a specified parameter grid. This approach helps identify the best combination of hyperparameters that maximize the model’s accuracy and minimize overfitting.
IV. EXPERIMENTAL RESULTS
In this study, the JAFFE (Japanese Female Facial Expression) dataset [24] and the CK+ (Extended Cohn-Kanade) dataset [25] were used to evaluate the performance of the proposed method. The JAFFE dataset contains a diverse set of facial expressions from Japanese female subjects, providing a rich source of emotion-related facial data, particularly for studies focusing on gender-specific emotion recognition. The CK+ dataset, on the other hand, includes both posed and spontaneous facial expressions from a diverse group of subjects, which makes it suitable for evaluating the model’s robustness in real-world settings. By using these two datasets, which cover different aspects of facial expression variability, we aim to comprehensively assess the generalizability and effectiveness of the proposed method.
The JAFFE dataset provides a total of 213 face images, each in grayscale. A total of 10 Japanese female participants took part, with each participant being asked to express 7 different emotions. The 7 emotions include anger (AN), disgust (DI), fear (FE), happiness (HA), neutral (NE), sadness (SA), and surprise (SU). For each emotion, the dataset contains 30 images for AN, 29 for DI, 32 for FE, 31 for HA, 30 for NE, 31 for SA, and 30 for SU.
The 213 face images were split into training and test sets with a ratio of 8:2 (170 images for the training set and 43 images for the test set). The training set contained 24 images from the AN class, 23 from the DI class, 25 from the FE class, 25 from the HA class, 24 from the NE class, 25 from the SA class, and 24 from the SU class, resulting in an imbalance between the classes. To address this imbalance, data augmentation was performed to ensure an equal number of images for each emotion class, with a target of 200 images per class. Using data augmentation techniques such as flipping, adding noise, brightness adjustment, and contrast adjustment, a total of 176 images were generated for the AN class, 177 for the DI class, 175 for the FE class, 175 for the HA class, 176 for the NE class, 175 for the SA class, and 176 for the SU class. As a result, the training set after data augmentation included 1,400 images (170 original images and 1,230 generated images).
The CK+ dataset contains a total of 981 grayscale images. A total of 123 participants (38 males and 85 females) contributed to the construction of the CK+ dataset. The participants’ ages ranged from 18 to 50 years, with 81% being European American, 13% African American, and 6% from other groups. Each participant was asked to express a total of 7 emotions (AN, Contempt (CO), DI, FE, HA, SA, SU) through facial expressions. As a result, the CK+ dataset includes the following number of images for each emotion: 135 images for AN, 54 images for CO, 177 images for DI, 75 images for FE, 207 images for HA, 84 images for SA, and 249 images for SU.
The 981 face images were split into training and test sets with a ratio of 8:2 (784 images for the training set and 197 images for the test set). The training set contained 108 images from the AN class, 43 from the CO class, 142 from the DI class, 60 from the FE class, 165 from the HA class, 67 from the SA class, and 199 from the SU class, resulting in an imbalance between the classes. To address this imbalance, data augmentation was performed to ensure an equal number of images for each emotion class, with a target of 200 images per class. Using data augmentation techniques such as flipping, adding Gaussian noise, brightness adjustment, and contrast adjustment, a total of 92 images were generated for the AN class, 157 for the CO class, 58 for the DI class, 140 for the FE class, 35 for the HA class, 133 for the SA class, and 1 for the SU class. As a result, the training set after data augmentation included 1,400 images (784 original images and 616 generated images).
Since the emotion classes included in both FER datasets consist of 7 types, the FER task in this study is considered a multiclass classification problem. Among the ML algorithms that can be applied to multiclass classification problems, we evaluated the performance of the proposed FER method using four models: (1) stochastic gradient descent (SGD), (2) extra trees (ET), (3) random forest (RF), and (4) histogram-based gradient boosting (HGB). In addition, accuracy (ACC) was chosen as one of the evaluation metrics because it provides a straightforward measure of how well the model correctly classifies the emotion labels, which is critical for assessing the overall performance of FER systems. Additionally, for each of the 7 emotion classes, the true positive rate (TPR), positive predictive value (PPV), and F1-score (F1) values of each model were calculated. Then, the macro-average TPR, macro-average PPV, and macro-average F1 were computed using the mean values for the 7 emotions and used as evaluation metrics [26-35].
To validate the effectiveness of the proposed method, three approaches were benchmarked:
-
Baseline: This method extracts the face region from the original image and then converts the 64×64 grayscale face image into a 1-dimensional vector to be used as the input for the ML model.
-
CED: This method applies the Canny edge detection operator to the 64×64 face image, then converts the edge-detected image into a 1-dimensional vector to be used as the input for the ML model.
-
HOG: This method extracts HOG features from the 64×64 face image and uses the extracted features as the input vector for the ML model.
These three methods were chosen for benchmarking to evaluate the impact of different feature extraction methods—basic face region extraction, edge detection, and gradient-based feature extraction—on the overall performance of the FER system.
Table 1 shows the ACC of each FER technique on the JAFFE dataset. To clarify, the FER techniques are named based on the feature extraction method and ML model used. For example, in Proposed+SGD, the proposed feature extraction method and SGD classifier were used. As another example, in Baseline+RF, one of the benchmarking methods, Baseline, and RF classifier were used. According to the experimental results, the proposed technique, Proposed+SGD, achieved the highest ACC of 0.7209 among all the techniques. Among the benchmarking techniques, HOG+SGD demonstrated the highest ACC of 0.6744, while the lowest ACC of 0.4186 was achieved by CED+HGB.
| Model | Baseline | CED | HOG | Proposed |
|---|---|---|---|---|
| SGD | 0.6279 | 0.5116 | 0.6744 | 0.7209 |
| RF | 0.5581 | 0.5581 | 0.6046 | 0.6744 |
| ET | 0.5813 | 0.5348 | 0.6511 | 0.6744 |
| HGB | 0.5348 | 0.4186 | 0.6512 | 0.6744 |
Fig. 5 shows the confusion matrices of the ML models that achieved the highest ACC for each proposed and benchmarked method in the experiment from Table 1. The proposed technique, Proposed+SGD, correctly predicted 31 out of 43 test images and showed the fewest misclassifications compared to the other techniques. Among the benchmarking techniques, Baseline+SGD correctly predicted 27 out of 43 test images, CED+RF correctly predicted 24 out of 43 test images, and HOG+ SGD correctly predicted 29 out of 43 test images. Based on the results from the confusion matrices in Fig. 5, we calculated the macro-average values of TPR, PPV, and F1.
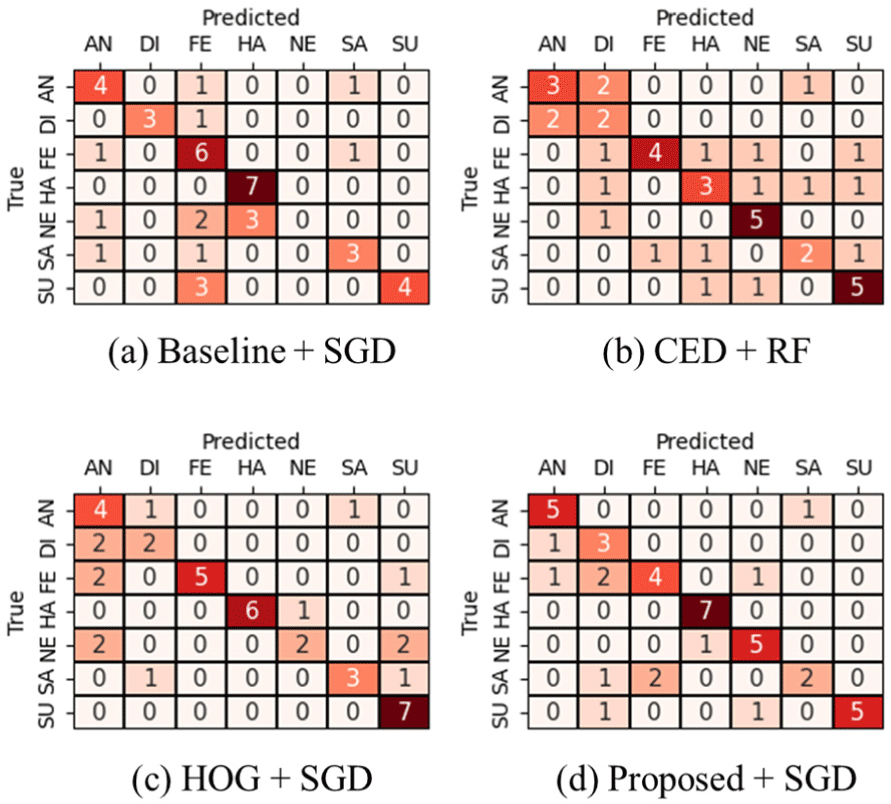
Table 2 shows the macro-average values of TPR, PPV, and F1 for each technique on the JAFFE dataset. From the table, it can be observed that Proposed+SGD performs best in terms of all evaluation metrics. Among the benchmarking techniques, HOG+SGD achieved the best performance, while CED+RF achieved the worst performance.
| Combination | Macro-average | ||
|---|---|---|---|
| TPR | PPV | F1 | |
| Baseline+SGD | 0.6197 | 0.6143 | 0.5955 |
| CED+RF | 0.5537 | 0.5622 | 0.5445 |
| HOG+SGD | 0.6546 | 0.7076 | 0.6545 |
| Proposed+SGD | 0.7187 | 0.7236 | 0.7031 |
Table 3 lists the ACC of each FER technique on the CK+ dataset. According to the experimental results, the proposed technique, Proposed+HGB, achieved the highest ACC of 0.9188 among all the techniques. Among the benchmarking techniques, HOG+ET achieved the highest ACC of 0.8731. In addition, HOG+RF comes in second with an ACC of 0.8680. On the other hand, CED+RF and CED+ET achieved the lowest ACC of 0.8121.
| Model | Baseline | CED | HOG | Proposed |
|---|---|---|---|---|
| SGD | 0.8528 | 0.8477 | 0.8629 | 0.9035 |
| RF | 0.8274 | 0.8121 | 0.8680 | 0.9086 |
| ET | 0.8375 | 0.8121 | 0.8731 | 0.9086 |
| HGB | 0.8426 | 0.8324 | 0.8528 | 0.9188 |
Fig. 6 shows the confusion matrices of the ML models that achieved the highest ACC for each proposed and benchmarked method in the experiment from Table 3. The proposed technique, Proposed+ HGB, correctly predicted 181 out of 197 test images and showed the fewest misclassifications compared to the other techniques. Among the benchmarking techniques, Baseline+SGD correctly predicted 168 out of 197 test images, CED+ SGD correctly predicted 167 out of 197 test images, and HOG+ET correctly predicted 172 out of 197 test images. Based on the results from the confusion matrices in Fig. 6, we calculated the macro-average values of TPR, PPV, and F1.
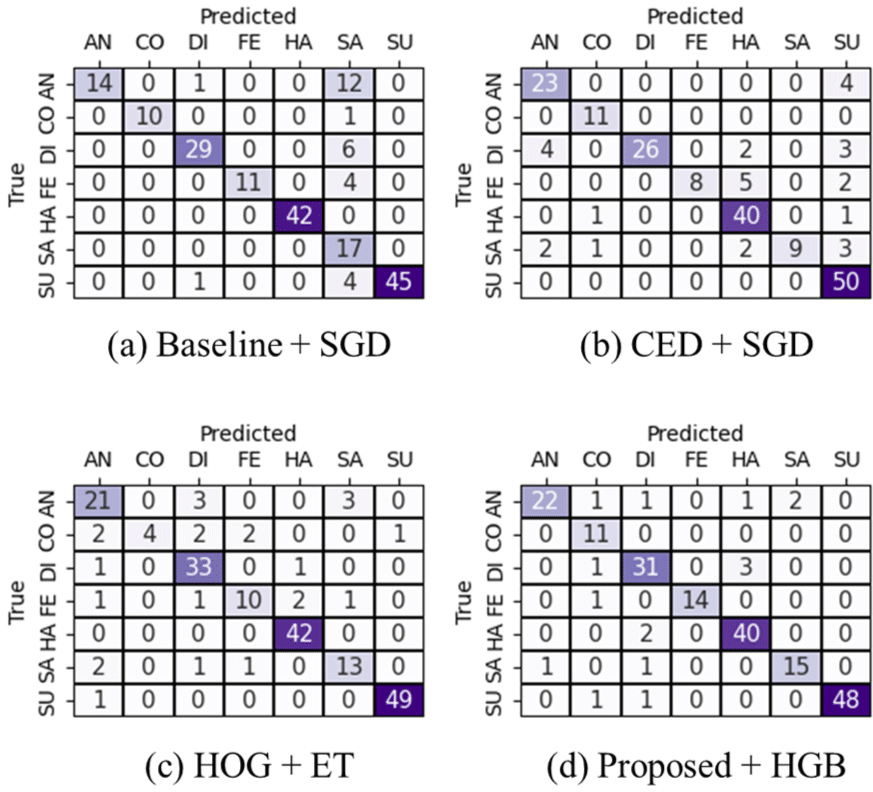
Table 4 presents the macro-average values of TPR, PPV, and F1 for each technique on the CK+ dataset. As shown in the table, Proposed+HGB outperforms all others across all evaluation metrics. Among the benchmarking techniques, Baseline+SGD delivered the best performance, while HOG+ET recorded the lowest performance.
| Combination | Macro-average | ||
|---|---|---|---|
| TPR | PPV | F1 | |
| Baseline+SGD | 0.8414 | 0.9031 | 0.8379 |
| CED+SGD | 0.8014 | 0.8927 | 0.8204 |
| HOG+ET | 0.7851 | 0.8603 | 0.8002 |
| Proposed+HGB | 0.9184 | 0.9061 | 0.9082 |
V. DISCUSSION AND FUTURE DIRECTIONS
Regarding FER, it has significantly evolved with the advent of advanced feature extraction techniques. In this study, we propose a novel approach that combines the Canny edge detection operator and HOG to extract features from facial images, focusing on contour and wrinkle patterns that reflect emotional states. The reason we used traditional ML models rather than deep learning models in this study is that traditional models can perform emotion recognition effectively, even with relatively small datasets. Specifically, for datasets such as the JAFFE dataset, the number of data samples is insufficient for deep learning models to learn reliably. On the other hand, while the CK+ dataset provides sufficient data for emotion recognition, some advanced neural network models may still require large amounts of data and extended training times. As a result, we focused on a feature-based approach to enable faster and more effective learning for our model.
Recent studies in FER have increasingly adopted deep learning techniques, such as CNNs, for feature extraction due to their ability to automatically learn hierarchical features from raw data [7,8]. However, these methods often require large amounts of labeled data and computational resources, making them less suitable for environments with limited data or resources.
In contrast, our approach leverages classical feature extraction techniques, such as the Canny edge detection operator and HOG, to capture critical contour and wrinkle information from facial images. These features are crucial for identifying subtle facial expressions, which deep learning models may struggle to learn from sparse data. Our method aligns with recent efforts to improve FER systems’ performance by combining low-level, interpretable features (such as edges and gradients) with ML models that can generalize well even with smaller datasets. For example, the authors of [8] have highlighted the importance of edge-based features in capturing fine-grained facial expressions, which our proposed method effectively utilizes.
Moreover, compared to recent FER methodologies that focus primarily on deep learning-based feature extraction, our approach emphasizes a hybrid strategy—combining traditional computer vision techniques (Canny edge detection, HOG) with ML models. This hybrid approach not only improves accuracy but also offers a more computationally efficient alternative, particularly in resource-constrained environments. We believe our method contributes to ongoing research by bridging the gap between classical feature extraction methods and modern ML techniques, providing a robust solution for FER tasks with potentially lower computational overhead.
However, as mentioned earlier, numerous studies have recently applied deep learning models to FER, and large-scale FER datasets are also being made available online. Therefore, we aim to extend and compare the results of this study in future work by using deep neural network models, such as CNNs. The application of CNNs is expected to yield higher accuracy, which will be an important opportunity to further enhance the performance of this study [36-54].
VI. CONCLUSION
This paper proposes a method for emotion recognition from face images using the Canny edge detection operator and HOG. To validate the effectiveness of the proposed method, experiments were conducted using two publicly available FER datasets (JAFFE and CK+). The experimental results showed that the ML models applying the proposed method achieved the best performance on both datasets. However, the JAFFE and CK+ datasets used in this study only provide frontal face images, meaning the ML models were trained and evaluated using only frontal face images in the experiments. Considering real-world scenarios, face images can be captured from various angles. Future research will focus on extending and developing the proposed FER method to be applicable to face images captured from different angles, addressing challenges related to pose variations and improving model robustness in diverse real-world settings.

