I. INTRODUCTION
Establishing reliable correspondence between two-view images is a fundamental task in numerous computer vision applications, including image registration, object tracking, feature matching, and 3D imaging. The Random Sample Consensus (RANSAC) algorithm is a robust approach designed to handle data containing a high percentage of outliers by iteratively identifying consensus sets that best fit the model [1]. RANSAC has become widely used for accurately determining point correspondences under the epipolar geometry constraint in two-view images, enabling the computation of the homography matrix and fundamental matrix from data contaminated by outliers.
Over time, researchers have developed variations and improvements to the basic RANSAC algorithm to enhance its efficiency, accuracy, and applicability to different problems. Notably, the application of RANSAC for outlier elimination has found success in diverse areas such as accurate object tracking [2], precise image matching [3-19], multi-view image registration [4], image stitching [6], pose estimation challenges [8,20], remote sensing image analysis [11], and panoramic image applications [13]. These studies have introduced enhancements to RANSAC, improving its ability to detect inliers [5,16-17],[20], refining its process for fundamental matrix estimation [7,15,18], adapting it for different geometric scenarios [9], enhancing camera parameter estimation [10], and addressing outlier challenges in 3D image generation [12,14].
This paper aims to conduct a comparative analysis of two prominent RANSAC-based approaches: the homography matrix-based RANSAC and the fundamental matrix-based RANSAC. Our focus is on accurately estimating point correspondences from two-view images under the constraints of epipolar geometry. We employed the RANSAC algorithm to estimate precise homography and fundamental matrices, and then conducted a comparison of these methods in terms of accuracy, robustness, and performance variations for finding correct point correspondences.
Despite the widespread use of RANSAC, there remains a need for a comprehensive comparison between homography and fundamental matrix-based approaches using this algorithm. By addressing this gap, we aim to investigate the strengths and weaknesses of each method, identifying where they work well or fail. This comparative study aims to provide valuable insights for practitioners and researchers in computer vision and related fields, aiding in the selection of appropriate techniques based on specific application requirements.
The structure of this paper is organized as follows: Section 2 describes the mathematical models of the homography matrix, fundamental matrix, and the RANSAC method. Section 3 presents the processing techniques employed for outlier detection through the proposed estimations. Section 4 discusses the comparison results between the homography and fundamental matrix-based RANSAC methods, and Section 5 concludes the paper by summarizing key findings and discussing their implications.
II. MATHEMATICAL MODELS FOR USED METHODS
The RANSAC procedure begins with a small initial data set and iteratively expands it by incorporating consistent data to remove invalid data points. The formal steps of RANSAC are as follows [21]:
Randomly select a subset S1 of n data points from P, where P is the set of data points and n is the number of points needed to instantiate the model parameters.
Instantiate the model M1 using subset S1.
Determine the a consensus set P2 of points in P that are within some error tolerance of M1. Identify a consensus set, P2, consisting of points in P that fall within a specified error tolerance of M1.
If the size of P2 is greater than a threshold t(|P2|>t), where t is a function of the estimated number of gross errors in P, use P2 to compute a new model M2, possibly least using squares.
If |P2| is less than t (|P2|<t), randomly select a new subset S2 and repeat the process for a predetermined number of trials. If no consensus set with t or more members is found after the trials, either use the model with the largest consensus set found or terminate the process as a failure.
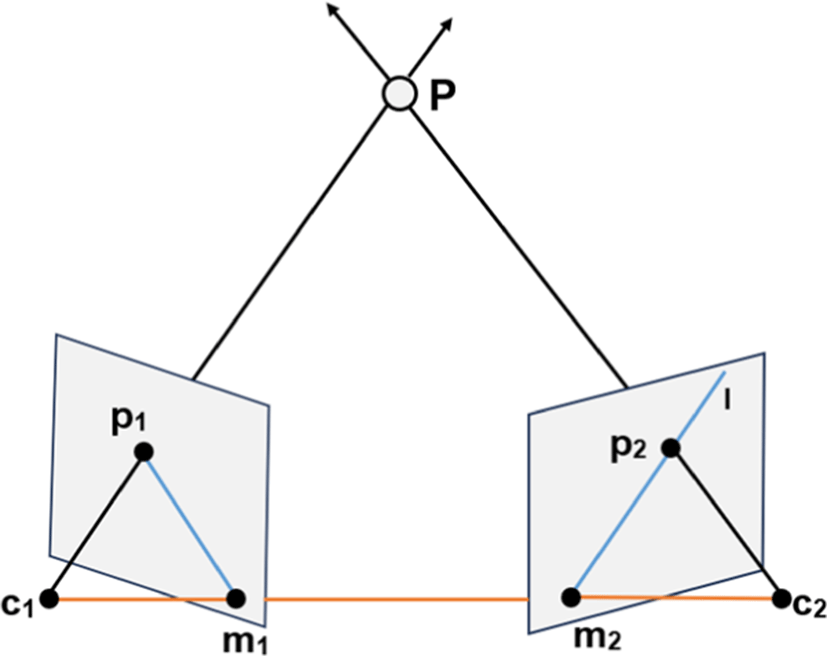
Consider two cameras observe a point P located at some distance in space, projected onto the points p1 and p2 of the image plane under perspective projection. The camera centers are denoted as c1 and c2. The baseline is connecting them. The epipolar plane defined by points c1, c2, and P, with m1 and m2 as the epipoles on the baseline and image planes. The line between the points p1 and m1 and the line between the points p2 and m2 are the epipolar lines [1].
In Fig. 1, the imaging of epipolar geometry illustrates that for each point p1 in one image, there exists a corresponding epipolar line l in the other image. Any point p2 in the second image matching the point p1 must lie on the epipolar line l. This mapping from points to lines is represented by a unique 3×3 rank 2 homogeneous matrix, the fundamental matrix F as follows:
where
The fundamental matrix represents the geometric relationship between two images of the same scene and is typically estimated using at least eight point correspondences. It’s an essential concept in computer vision for various tasks related to image analysis and scene understanding.
To compute the fundamental matrix using RANSAC and exclude outliers, we employ the following algorithm:
-
Set the loop counter i to zero, and the number of loops N to the specified number of random trials.
-
Loop through the following steps while i is less than N:
-
a) Randomly select 8 pairs of points from p1 and p2.
-
b) Use the selected 8 points to compute a fundamental matrix F.
-
c) Compute the inliers for all points in p1 and p2 based on ||p2TFp1|| <t.
-
d) If there are more inliers than in the previous best, replace F with the best matrix.
-
e) Increment i by 1.
-
The homography describes the mapping between two images that observe the same planar surface. By multiplying the homography matrix with points p1 in one image, it allows to find their corresponding points p2 in the other image. Thus, any point in the first image can be mapped to a corresponding point in the second image through homography. Mathematically, it is represented as follows:
where H is a 3×3 homogeneous matrix given by:
Its element, h33 is normalized to 1 so that H has only 8 degrees of freedom. To solve the homography matrix, we need at least four point pairs of matched corresponding points. In practice, we usually use more than four pairs of corresponding points due to noise.
We use the following RANSAC algorithm to exclude outliers and compute the homography matrix from inliers:
III. IMPLEMENTATION STEPS FOR MATCHING IMAGES
We implemented the estimations using Visual C++ and the OpenCV (Open Source Computer Vision Library) version 4.6.0 on a PC equipped with an Intel i7-9700 CPU running at 3.0 GHz, 16 MB of RAM, and a Microsoft LifeCAM. In this section, we explain the processing steps for implementing the two estimations for finding correct point correspondences.
We captured hundreds of images of an object for the experiment, selecting the first captured image as the left image and subsequent images as the right images. Then feature points p1 in the left image were extracted using the ORB (Oriented FAST and Rotated BRIEF) feature detection algorithm. Similarly, feature points p2 in the right image were also extracted.
Secondly, feature points in the left image were matched with feature points in the right image using the Nearest Neighbors Approach, resulting in a correspondence set containing both false matched pairs and correctly matched pairs.
Thirdly, the homography matrix and fundamental matrix-based RANSAC approaches were estimated to find the correct correspondences between the two images.
Finally, we compared the results obtained from the homography matrix and fundamental matrix with RANSAC and analyzed their performance using image datasets containing both planar and 3D objects.
IV. EXPERIMENTAL ANALYSIS
We conducted experimental analyses to evaluate the results of finding the correct correspondences (inlier point correspondence) using the homography matrix-based RANSAC (RANSAC_H) and fundamental matrix-based RANSAC (RANSAC_F) methods. To simplify notation in the experimental results, we renamed these methods accordingly.
We created test datasets by capturing images while varying object positions in front of a stationary camera. The images were captured at a resolution of 640×360 pixels. In the left image, the object position was arbitrarily fixed, while in the right image, the object position was translated along the x, y, and z axes and rotated around the x, y, and z axes. Translations along the x and y axes ranged up to 150 mm, while translations along the z-axis varied between 200-600 mm from the camera. Rotations around the x and y axes varied up to 20 degrees, and rotations around the z-axis varied up to 90 degrees in both clockwise and anti-clockwise directions. These datasets included hundreds of images of the moving object.
For the prepared dataset, we experimentally examined and compared the performance of RANSAC_H and RANSAC_F methods. We compared the number of inlier and outlier correspondences between the left and right images. In the first case, we varied the rotation of the object in the images up to 20 degrees around the y-axis. Fig. 2 illustrates the comparisons of the numbers of correct and false correspondences computed from RANSAC_H and RANSAC_F methods. We denoted the correct and false correspondences from RANSAC_H as Inlier_H and Outlier_H, respectively, and from RANSAC_F as Inlier_F and Outlier_F, respectively.
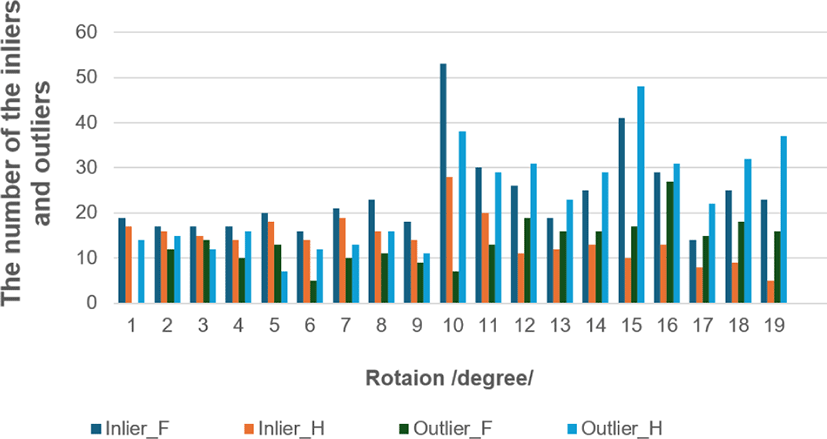
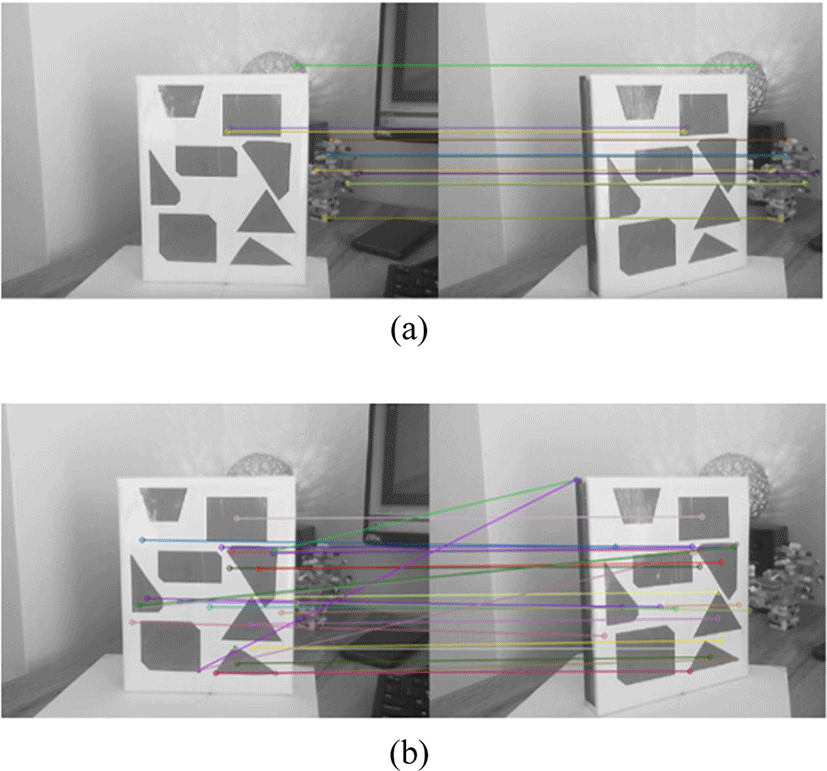
From Fig. 2, we observe that the number of inliers (Inlier_F) is consistently higher than the number of inliers (Inlier_H) computed using RANSAC_F and RANSAC_H, respectively. As the rotation of the object around the y-axis increases, not only does the number of inliers decrease for RANSAC_H, but also the number of outliers (Outlier_H) increases. This suggests that RANSAC_H struggles with this dataset, likely due to its geometric assumptions, classifying many correct correspondences as outliers. Specifically, most of the inlier correspondences identified by RANSAC_H were associated with the background part of the moving object in the images, as shown in Fig. 3.
In the second case, where the rotation of the object in the images is varied up to 60 degrees around the z-axis, we computed inlier correspondences using both the RANSAC_H and RANSAC_F methods. We then compared the number of inlier correspondences between the left and right images. Fig. 4 illustrates the comparisons of the numbers of correct correspondences computed from the RANSAC_H and RANSAC_F methods.
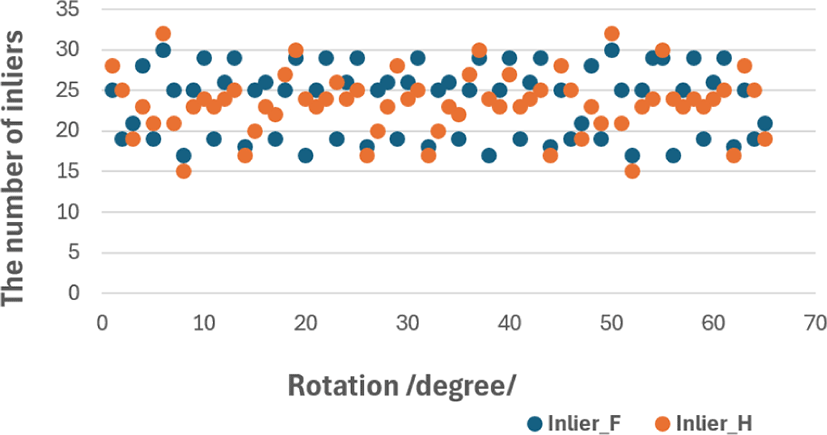
From Fig. 4, it’s evident that the numbers of inlier correspondences (Inlier_F and Inlier_H) are similarly scattered. This similarity in distribution suggests that when the object is rotated around the z-axis, the computational results for inlier correspondences do not significantly differ between the two methods. The rotation of the object around z-axis doesn’t create 3D effect on the moving object like rotations around x or y axis. This observation implies that RANSAC_H works well for planar movement of the object.
In the final case, we assessed the performance of both methods in finding correct correspondences across three distinct datasets. The first dataset involved images with object rotations around the y-axis, categorized into R1 (0−5 degrees), R2 (5−10 degrees), R3 (10−15 degrees), and R4 (15−20 degrees).
For the second dataset, we rotated the object simultaneously around the y and z axes. Images were classified as R5 (y: 15 degrees, z: 0−10 degrees), R6 (y: 15 degrees, z: 10−20 degrees), R7 (y: 15 degrees, z: 20−30 degrees), R8 (y: 15 degrees, z: 30−40 degrees), and R9 (y: 15 degrees, z: 40−50 degrees).
The third dataset involved rotations around the y axis with fixed rotations of x: 10 degrees and z: 90 degrees. Images were classified as R10 (y: 0−4 degrees), R11 (y: 4-8 degrees), R12 (y: 8−12 degrees), R13 (y: 12−16 degrees), and R14 (y: 16−20 degrees).
We computed the correct corresponding points for each image dataset using RANSAC_H and RANSAC_F methods and showed the average number of correct correspondences in Fig. 5. Consistently, Fig. 5 shows that RANSAC_F yielded more correct correspondences compared to RANSAC_H.
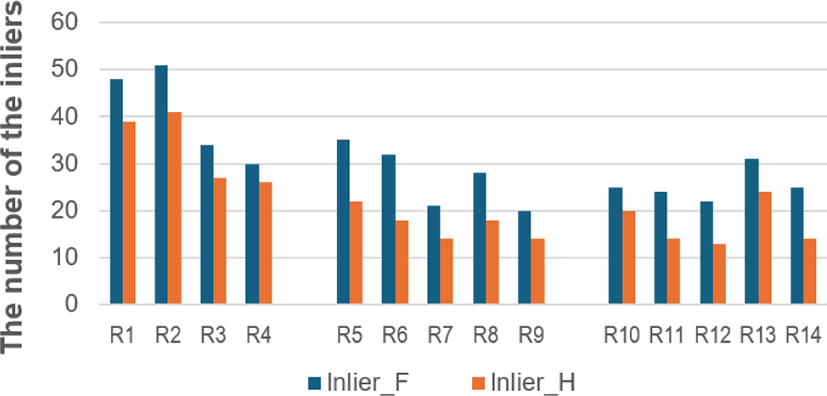
In general, as the degree of 3D rotation increased, the number of correct corresponding points decreased for both methods. This effect is particularly notable for rotations around the x or y axis due to scaling side-effects, leading to noisy and unstable matched point correspondences.
V. CONCLUSION AND LIMITATION
This study conducted a comparative analysis of homorgaphy matrix-based RANSAC (RANSAC_H) and fundamental matrix-based RANSAC (RANSAC_F) methods for outlier elimination in computer vision applications. The findings indicate that RANSAC_H performs well with planar movements, while RANSAC_F is more suited for 3D movements. However, limitations were identified:
Noise Sensitivity: Both methods are sensitive to noise, which can affect the accuracy of outlier detection and corresponding point estimation.
Computational Complexity: The iterative nature of RANSAC algorithms can lead to high computational costs, especially for large datasets with many outliers.
In summary, while both RANSAC_H and RANSAC_F have their strengths in handling different types of movements, they are both sensitive to noise.

