I. INTRODUCTION
BC is the node ranking algorithm that ranks nodes based on their involvement in spreading information through the network. If BC score for a node is high, it means that a node is an important player in spreading information in the network. Let’s see some of the applications of BC in networked system. BC is used in analyzing distributions of the citizens and road traffic between the region currently under development and other regions of the city [1]. Structural properties of the networks consist functional units of the brain when it’s under problem solving process are studied using BC [2]. Its results show that BC can help in the design of brain-computer interfaces for the estimation of cognitive load of brain. Researchers of the work [3] concluded that incomplete connections of a network can be predicted using BC. BC is used in analyzing the locations of the people involved in drug trafficking to show that the identities with high BC has a lesser probability of getting arrested [4].
It is rare for the nodes distanced far away to exchange information with each other in real world network. In some applications, these nodes can be considered disconnected. K-BC ranks the nodes based upon this assumption by not including the paths which are too long (more than k hops away in unweighted graph or more than k distance away in weighted graph) [5-8]. Therefore, it highlights those nodes which are actively engaged in the communication of the network. In other words, k-BC has its own applications which BC can’t be good at [9].
Fastest known algorithm for calculating BC, Brandes’ algorithm, runs in O(nm) time complexity where n is the number of nodes and m is the number of edges [10]. It runs single source shortest path algorithm from every vertex and updates BC scores accordingly. The choices of single source shortest path algorithm are BFS algorithm for unweighted graph (O(n+m)), and Dijkstra’s algorithm for weighted graph (O(m+nlogn)) [11]. Therefore, the running time of Brandes’ algorithm is O(nm) for unweighted graph and O(nm+n2logn) for weighted graph. Real world datasets are getting larger and larger and it is crucial for BC algorithms to run faster in order to process large scale of data available. It’s possible to estimate BC score by sampling the nodes from which single source shortest path algorithm runs, instead of running it from all the nodes [12-15]. There are not many works done to estimate k-BC although it mentioned in [14] possibility of using k-bounded-betweenness with their algorithm. Our contribution is that distance limited versions of estimated BC [13] and approximate BC [14] are designed namely estimated k-BC (ek-BC) and approximate k-BC (ak-BC). Both reduce algorithmic complexity O(rm) to O(rdk) by their distance limted nature. We show their convergences with k-BC algorithm. Also, running time and quality of node ranking are studied using various methods and compared against their original algorithms. Lastly, we will show their application on a weighted network. Our proposed algorithms are defined in second section. Third sections contain the experimental results. Fourth section contains conclusion of our work.
II. ESTIMATED K-BC
Given a graph G=(V,E), betweenness value of a vertex v∈V is defined by the sum over all s,t pair dependency (equation (1)). Pair dependency is the ratio of the number of the shortest paths between s and t which includes v(σst[v]) to the number of the shortest paths between s and (σst). BC exacts how much information is flowing through a node if information travels in shortest paths.
Brandes’ algorithm finds an exact betweenness value by dynamic programming technique to cleverly update pair dependency after each single source shortest path runs. We will refer to this algorithm [10] as BC from now on. While multi-path single source shortest path algorithm from s node is running, it stores predecessor set πs [v] and σs [v] the number of shortest paths from s to v for every node v. Then, δs [v] the pair dependency of node v starting from s node is πs [v]=[Σt∈vδst[v]. This can be further expanded by introducing vertex and edge combination as shown in equation 2 where δst [v,(v,w)] denotes the dependency of the paths taking (v,w) edge from v on all s–t shortest paths. Total dependency of v starting from s node (δs [v]) can be summed over δst [v,(v,w)] where w is the node whose predecessor is v on s–t shortest paths. In other words, all the shortest paths where one visits v and then w node are included in δs [v].
The dependency of v node and edge (v,w), δst [v,(v,w)], can be written as the relation shown in equation (3). This relation is trivial when t=w since σst number of s–t shortest paths is equal to σsw, of which exactly σsv of them passes through v and uses (v,w) edge to reach w node.
Now for t≠w case, number of the s–t shortest paths which include w node is equal to σst[w]=σswσwt. Because all the s–w shortest paths can be merged with w–t shortest paths to create s–t shortest paths if w is on s–t shortest path. Number of w–t shortest path becomes σwt=σst[w]/σsw from previous definition. Then, number of shortest paths passing through v and taking (v,w) edge is the multiplication of σsv and σwt and replacing σwt with previous definition gives following equation.
We divide this equation by σst to get δst[v,(v,w)] dependency (equation(3)).
Now, if we use the system of equations (equation (3)) in equation (2) which finds dependency of v node starting from s source node, we get the following equation.
It can be seen from the equation that δs [v] is recurrent. So the dynamic programming technique can be applied. We can process this recurrence starting from the nodes furthest from the source. Iterating over all s ∈ V to add up δs [v] gives betweenness centrality in O(nm) complexity on unweighted graph.
Estimated betweenness (e-BC) algorithm [13] is similar to BC but instead of calling SSSP from every node, it samples r number of vertices and calls SSSP algorithm from each of the sampled vertices. So, we have partial dependencies from r SSSP calls. In order to extrapolate this information, current betweenness value of each v node is multiplied by 2n/r. This algorithm is known to produce good approximation result although there is no theoretical error estimation in the paper. Its time complexity is O(rm) for unweighted graphs and O(rm+nrlog n) for weighted graphs.
Approximate betweenness (a-BC) algorithm [14] samples paths unlike e-BC. It determines sampling size r from algorithm parameters and diameter of a given graph. Then, it chooses u and v nodes randomly and runs SSSP algorithm from u to v. For each sample u and v, it samples a path with weight according to number of shortest paths running through each node on u–v shortest paths. Each node on the sampled path receives 1/r value added to its BC. Unlike e-BC, estimated betweenness values of a-BC has theoretical bound epsilon (deviations are within epsilon with probability 1–δ). Its time complexity is O(rn) for unweighted graphs and O(rm+nrlog n) for weighted graphs. Its running time is the same as e-BC but it runs slower than e-BC because it chooses larger sample size to achieve a theoretical bound.
k-BC algorithm [7] puts distance limit on shortest paths. k-BC is used in new types of problems like DCNP and some real-world cases. Also, it can be an effective estimated betweenness measurement. Distance limit is a hop distance for unweighted graphs. Graph traversal is stopped when hop distance reaches k in BFS algorithm. Time complexity of BFS becomes O(dk) where d is branch factor and k is distance limit. Distance limit k=3 is used in distance limited problems like DCNP making single BFS call a constant when branch factor is small [21]. Distance is limited by range for weighted graph. We can stop Dijkstra’s algorithm once the distance of the current minimum exceeds the range limit. K-BC alone is able to reduce running time drastically when graph is sparse which is the case for real world instances.
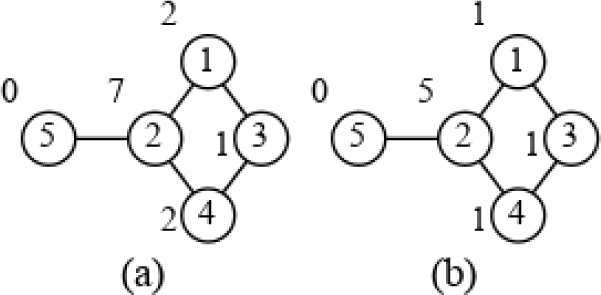
BC and k-BC values are illustrated on a simple graph in Fig. 1(a) and Fig. 1(b) (k=2 is used) respectively. Let’s see how BC value of node 2 is calculated. First, BFS from node 1 is called. Then, starting from the furthest node which is 5, pair dependencies are calculated. Ratio is added to the dependency of predecessor 2. In the same way, is added to the dependency of predecessor 2 when node 4 is processed next. Because there are two shortest paths from 1 to 4 and and only one of them passes through 2. Then, there is no other nodes from source 1 to contribute to node 2. When BFS is called from 3, the path from 3 to 5 adds . When BFS is called from 4, the paths from 4 to 5 and 4 to 1 add 1 and respectively. The paths from 5 to 1, 5 to 4 and 5 to 3 add 1, 1, and respectively. Total of these dependencies sum up 7. K-BC is calculated in the same way but only the paths with length less than or equal to k=2 is considered. Therefore, k-BC value of node 2 consists of the dependencies from the paths 1 to 5, 5 to 1, 1 to 4, 4 to 1, 4 to 5 and 5 to 4.
We created estimated k-betweenness algorithm (ek-BC) by combining e-BC with k-BC. We replaced SSSP algorithm in e-BC with distance limited version. Pseudo code of ek-BC is shown in Algorithm 1. It takes G=(V,E) graph, r sample size and k distance bound. First, it initializes BC array to store betweenness values for all vertices (lines 1–2). Then, it samples r vertices from V randomly. For each sampled vertex s in V, it fills dependency array with zeros and calls multipath SSSP limited by k which returns S explored vertices sorted by their distance from s node, σ number of shortest paths passing through a vertex and predecessor array. Predecessor array is an array of arrays since each node can have multiple predecessors for storing multiple shortest paths. The vertices are processed starting from the furthest vertex from s node. For each u node, its dependency contribution to the predecessor nodes is calculated and added to the corresponding predecessor (lines 13–14). If u node is not s node, its dependency starting from s node is finalized and added to BC[u] (lines 15–16). Finally, BC calculation is scaled by multiplying each BC value by 2n/r (line 18).
1: for ∀u∈V
2: BC[u]←0
3: V′ ← {randomsampleofrverticesfromV}
4: for ∀s∈V′
5: for ∀u∈V
6: δ[u]←0
7: // S explored nodes sorted by distance from s
8: // σ number of shortest paths
9: // pred is the predecessor array of arrays
10: S,σ,pred = multipath_k_SSSP(G,k,s)
11: whileS≠∅
12: u ←S.pop() // poplastvertex
13: for ∀v∈pred[u]
14: δ[v]←δ[v]+(σ[v]/σ[u])∙(1 +δ[u])
15: ifu≠s
16: BC[u]←BC[u]+δ[u]
17: for ∀v∈V
18: BC[v]←BC[v]∙(2n/k)
Approximate k-betweenness (ak-BC) algorithm is created by combining k-BC with a-BC (Algorithm 2). First, the diameter of a given graph is estimated to calculate the sample size needed. Given ∨ and δ parameters, it calculates number of samples need to achieve the bound which states that the deviation of approximate betweenness value is within ∨ with probability 1–δ. Then, it initializes BC array to zero. For each of the r samples, u and v nodes are selected randomly and multipath SSSP limited by k is called to find all the shortest paths between u and v (lines 6–7). Then, it selects a single path among the shortest paths with weighted probability (lines 9–18). Selection process starts with v endpoint and next intermediate vertex (predecessor of the current vertex) is chosen by a weighted random choice (lines 12–15). The weight assigned to each predecessor depends on number of paths passing through it. Higher the number of shortest paths passing through a node is, the more likely it is for the node to be chosen. If the chosen vertex is not an endpoint, its betweenness value is increased by 1/r (lines 17–18).
1: vd←estimate_diameter(G)
2: r =1/〖e〗^2 ∙(⌊log2(vd – 2)⌋+1+log(1/(δ)))
3: for ∀u∈V
4: BC[u]←0
5: fori←1 tor
6: u,v ←randomsample 2 nodesfromV
7: σ,pred = multipath_k_SSSP(G,k,u)
8: t←v
9: whilet≠u
10: W←∅
11: S←∅
12: for ∀z∈pred[t]
13: S←S∪{z}
14: W←W∪ {(σ[z])/(σ[t])}
15: z ←weightedrandomchoice 〖z〗_(j)∈Swith 〖w〗_(j)∈Wweight
16: t←z
17: ifz≠u
18: bc[z] = bc[z]+1/r
Time complexity of ak-BC and ek-BC depends on the sample size and SSSP algorithm used. It is shown that distance limited BFS call takes O(dk) time and it becomes a constant when branching factor d is small [21]. So, time complexity of both algorithms is O(rdk) for unweighted graph. As for weighted graph, it’s difficult to draw time complexity because it depends on the search space of range limited Dijktra’s algorithm. But, it is likely to be small if the range used is an average of the shortest path distances within some small hop distance [16].
III. EXPERIMENT
We will compare our proposed algorithms with BC, k-BC, e-BC and a-BC in terms of running time and quality of the produced results. Distance limits k∈{3,4} are considered for unweighted graphs. Outputs of all the algorithms are normalized BC values. We chose log3n sample size for e-BC algorithm. The parameters of a-BC based algorithms are ∨ = 0.005 and δ = 0.1 for the following reasons. First parameter ∨ is chosen for accuracy for large graphs since they are normalized by n(n–1) factor. Second parameter δ is commonly chosen as 0.1 for precision [14]. These experiments are done on the machine with Intel(R) Core(TM) i7-7700 CPU @ 3.60 GHz CPU and 8 GB of RAM using Networkit [17] library and Python 3.10. We ran random algorithms 5 times and averaged their results. Proposed algorithms are implemented in the fork of Networkit library (Modified NetworKit library can be downloaded from https://github.com/denduuyum/networkit.git). Python script used in this work can be found here (https://github.com/dendu uyum/Estimated-k-betweenness.git).
Dataset consists of 7 real world networks (Table 1). We took most difficult (largest) networks used in [13] i.e. US patent network, co-paper Citeseer network, co-paper DBLP network and world wide web graph in addition to other well-known networks such as Twitter and Amazon co-purchasing network [18]. In order to see the performance of distance limited versions on a weighted graph, days.net network used in [19] is taken.
Twitter is a social network created by crawling from public resources where nodes are profiles and circles in Twitter platform and edges represent friendship and follow status among the vertices. Amazon is a copurchasing network on their online shopping platform where vertices represent products and an edge between two vertices means that they are bought together frequently. US patent network is largest among the others where vertex is a patent and there is an edge between two patents if the one cites the other. Co-paper Citeseer and co-paper DBLP networks are based on the data generated from Citeseer and DBLP networks respectively where nodes are papers and an edge between them means that two papers share an author. World wide web graph is formed by link connection between web sites. Days.net, called Reuters terror news network (downloaded from Pajek datasets), contains word relation data collected from Reuters news for 66 consecutive days after tragic September 11 incident. The vertices are words and weighted edges between them mean that two words were present in one sentence while weight represents their frequency. We converted every wi edge weight to Wmax + 1 – wi where Wmax = max(w_i) so that shortest paths pass through words which used most frequently. BC gives interesting information and used for data analysis. It is able to detect influential people in circles on social and collaboration networks such as Twitter. For Amazon network, BC is used to predict sales-rank of the products [22].
We run a single thread instance of each algorithm on Twitter and Amazon datasets and measured their running times in seconds using perf_counter method of Python time module. Their running times are compared against running time of BC to see relative speed gain empirically. Running time of the algorithms are shown in Table 2. Ratio column shows relative speed gain which is the running time of BC divided by the running time of current algorithm. We considered only Twitter and Amazon network for simplicity (It takes weeks to calculate exact betweenness of larger graphs). BC is the slowest of them – 1.9 hours and 18.3 hours for Twitter and Amazon networks respectively because it finds exact BC values. E-BC runs 22 and 48.7 times faster whereas a-BC runs 0.7 and 2.4 times faster than BC. A-BC runs slower than exact BC on Twitter showing that its sample size was bigger than number of nodes. Distance limited algorithms run faster on larger and sparser graph i.e Amazon. k-BC was faster than e-BC and a-BC on Amazon. Ek-BC (k=3) gained 18 and 28.7 times faster compared to k-BC on both networks.
| BC | ek-BC | ak-BC | |||||||
|---|---|---|---|---|---|---|---|---|---|
| k=3 | k=4 | k=3 | k=4 | ||||||
| 7,163.1 | 89.8 | 79.8 | 284.7 | 25.2 | 1,737.2 | 4.1 | 5,522.9 | 1.3 | |
| Amazon | 65,914.7 | 30.9 | 2,132.6 | 29.9 | 2,205.0 | 593.1 | 111.1 | 664.7 | 99.2 |
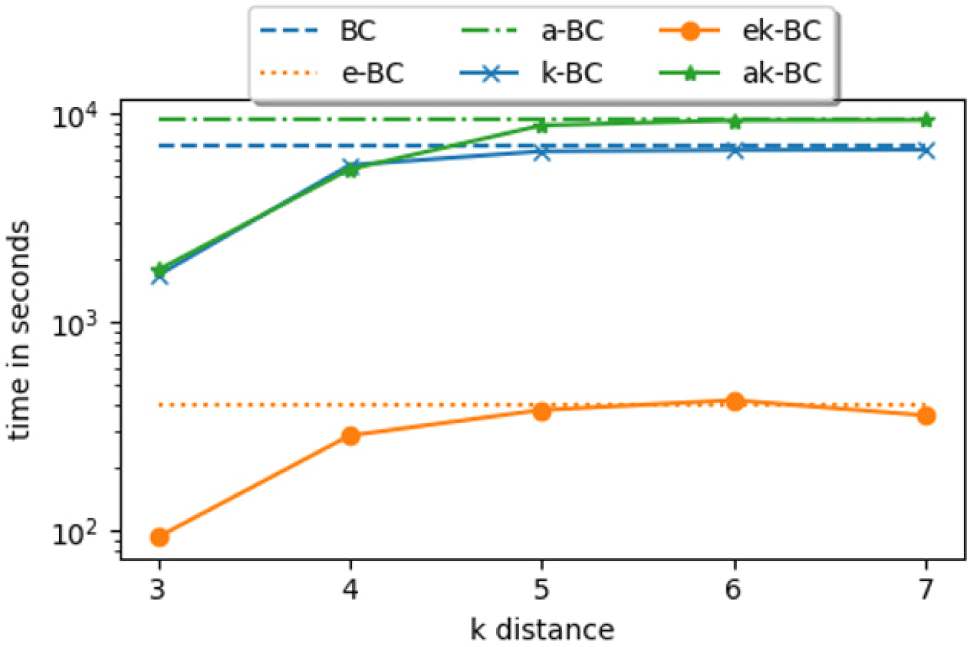
The algorithms show predictable behavior when effect of distance limit on running time is studied (Fig. 2). We used Twitter network whose diameter is 7. In the figure, running time of BC, e-BC and a-BC are constant as they are not distance limited. But we can see their running time differences (gaps). Running time of distance limited versions are closing in to their original algorithms at k=4 meaning that k=4 is already sufficient and covers most of the network. Since then, running time is around the same up and down little bit to their original running time. Running time fluctuation shows their random sampling nature. Number of paths in sampled nodes are larger than average and sometimes they are fewer. As we can see even at k=7 which is the diameter, the running time of ek-BC and ak-BC are faster than their original algorithms. When k increases, running time of distance limited algorithms are almost the same as their original versions.
Relative speed-ups gained by using ek-BC and ak-BC compared to k-BC are shown in Table 3. Ek-BC was 17.9–438.9 fold faster than k-BC. Both versions run faster when k=3 as predicted and speed-up increases as network grows larger. Speed-up gained by ak-BC is small compared to ek-BC. It runs 1–24.4 times faster than k-BC. On the other hand, ek-BC was at least 13 times faster than others. Estimated versions are faster because they have the best of the two worlds – distance limitation and estimation. Estimated algorithm halts when the distance limit is reached making the inner loop of the algorithms run faster while not causing any overhead.
Solution quality of proposed algorithms is studied in this section. BC values produced by e-BC, a-BC, ek-BC and ak-BC are compared against outputs of BC and k-BC using spearman’s correlation coefficient and Euclidean distance to see the solution compatibility with the original algorithms. Normalized betweenness values of n nodes are converted into n-dimensional vector in order to calculate euclidean distance. Also, we measured how many of top ranking L nodes of these algorithms are contained in the set containing top ranking 2L nodes of BC. Sizes of L are 10 and in this experiment.
Euclidean distances of all the algorithms to BC and k-BC are calculated on Twitter network using different k distances (Fig. 3). All the algorithms followed predicted behavior meaning that their solution quality is converging to their original algorithms when k increases. In Figure 2a, k-BC’s euclidean distance is 0 at k=7 which means there is no difference between k-BC and BC at this point. Because diameter of the graph is 7 and k-BC is distanced version of BC. Euclidean distances of e-BC and a-BC are plotted as horizontal lines since they don’t depend on k parameter and these distances represent their algorithmic limit. Their distance limited versions were started far from their original version and gets closer as k increases. By the time k=6, ek-BC and ak-BC produce the same output as e-BC and a-BC. It is seen from the distance that ak-BC and aBC perform little better than e-BC and ek-BC on this dataset. The fact that distance limited versions are distanced a bit from BC at the beginning could mean that they represent different information at the beginning. This information fades away and they become like BC as k increases.
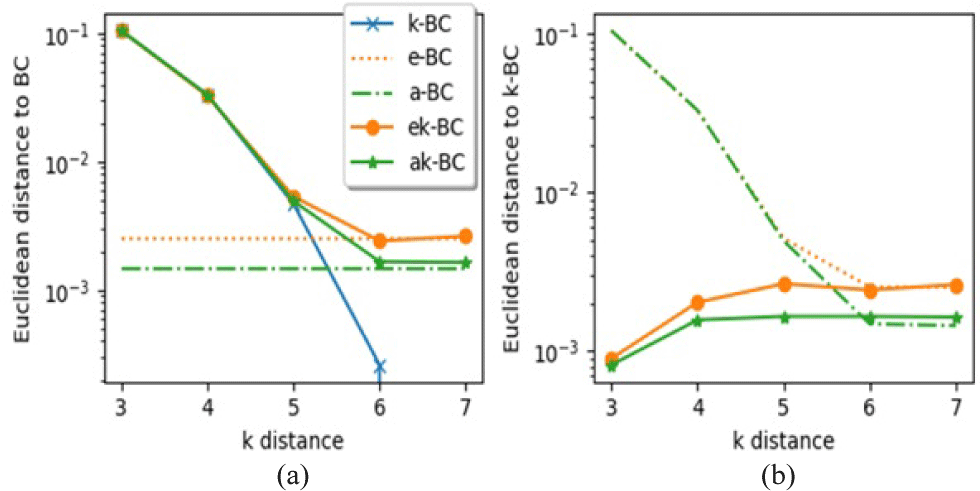
Fig. 3(b) shows Euclidean distance to k-BC. E-BC and a-BC look like getting closer to k-BC though they are not distance limited. This pattern is observed because k-BC changes to be closer to BC which is what they are approximate. On the other hand, ek-BC and ak-BC start very close to k-BC and get closer to their respective algorithms as k increases. This suggests that distance limited versions of the estimated algorithms are able to approximate k-BC. As k increases, they get close to their algorithmic limit which is estimating BC getting little distanced from k-BC while k-BC approaches to BC.
Solution closeness of ek-BC and ak-BC to k-BC is shown in Tables 4 and Table 5 using 4 different methods mentioned before. Tables show that spearman’s correlation coefficient is high for ek-BC for both k=3 and k=4. This means that its ranking is very close to the ranking of k-BC. Top-L columns confirm this result as we can see top 10 nodes of ek-BC are all in top-20 nodes of k-BC except Twitter and Amazon at k=3 where it misses only one node. When , ranking looks little bit off from k-BC but ek-BC was able to find most of them (k=3). This number improves when k=4 getting closer to k-BC which is our objective. For ak-BC, spearman’s correlation is low but it ranks top-10 and top- well for Twitter, co-paper Citeseers, co-paper DBLP and world wide web graphs. It probably needs more sampling to work through larger graphs. For Euclidean distance, ek-BC is better than ak-BC. We can observe that Euclidean distance grows larger and node ranking gets better as k increases due to the effect we observed in Fig. 3.
Centering Resonance Analysis used betweenness centrality [20]. We used our proposed algorithms on Reuters dataset. Then, we run BC, k-BC, ek-BC and ak-BC on the data and captured top 6 words with highest BC value (Table 6). In this case, range limited algorithms (k=1,100 is used) produced reasonable answers when correct range is given since increasing range means that more sentences are traversed making it difficult to grasp the main theme of the news. k-BC is able to find all the attack sites and cities while BC mixes up cities with uninformative word like people. Proposed ek-BC and ak-BC algorithms produced exact same results as k-BC in much shorter time.
IV. CONCLUSION
Distance limited versions e-BC [13] and a-BC [14] are designed and experimented. Both algorithms show convergence and compatibility with the result of k-bounded-betweenness. Therefore, they can be used in estimating k-BC in real world applications to cut running time drastically. Experimental results show that distance limited betweenness values can be calculated 18–439 times faster by using estimated algorithms. Distance limited version of e-BC shows better performance than the one based on a-BC both in running time and solution quality.